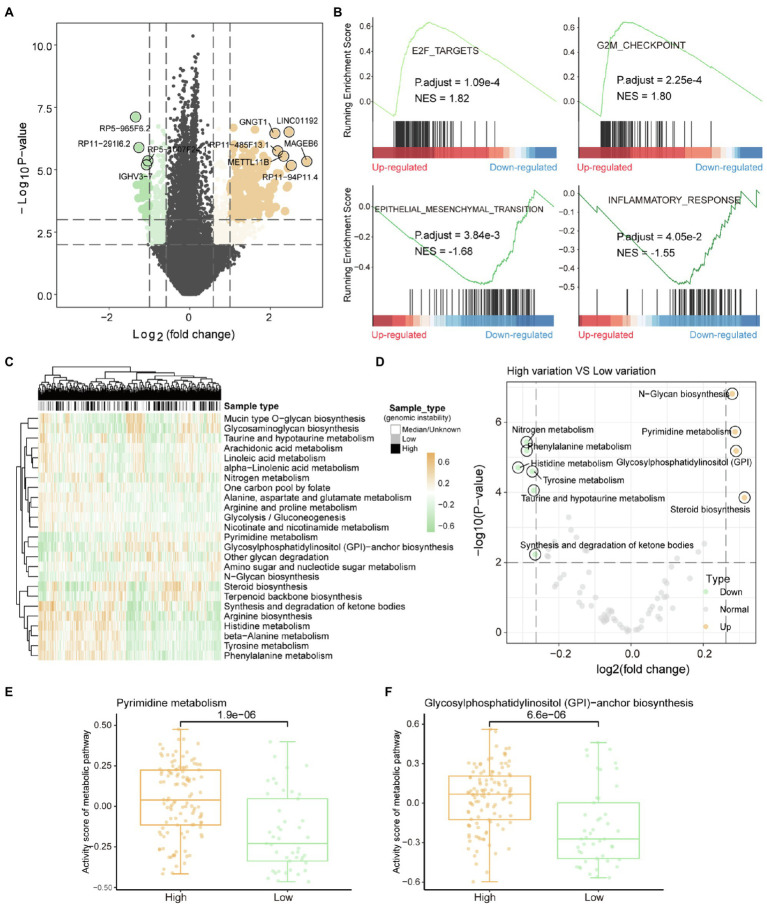
Figure 2.
Metabolic remodeling based on genome instability. (A) The results of the differential gene expression analysis between high-genomic instability and low-genomic instability samples are shown by the volcano graph. Grey dots represent non-differentially expressed genes, yellow dots indicate genes upregulated in high-genomic instability samples, and the green dots mean the opposite. (B) gene set enrichment analysis results of differentially expressed genes. Normalized enrichment score and corrected value of p are calculated. (C) The enrichment scores of tumor samples in each metabolic pathway calculated by GSVA are displayed by heat map. Column labels show sample types, including high-/low-genomic instability and median. (D) Analysis of the difference of metabolic pathway activity scores between high-genomic instability and low-genomic instability samples. (E,F) Comparison of pyrimidine synthesis and glycosylphosphatidylinositol-anchor biosynthesis pathway activity among high-/low-genomic instability samples. The rank sum test is used to calculate the significance.

