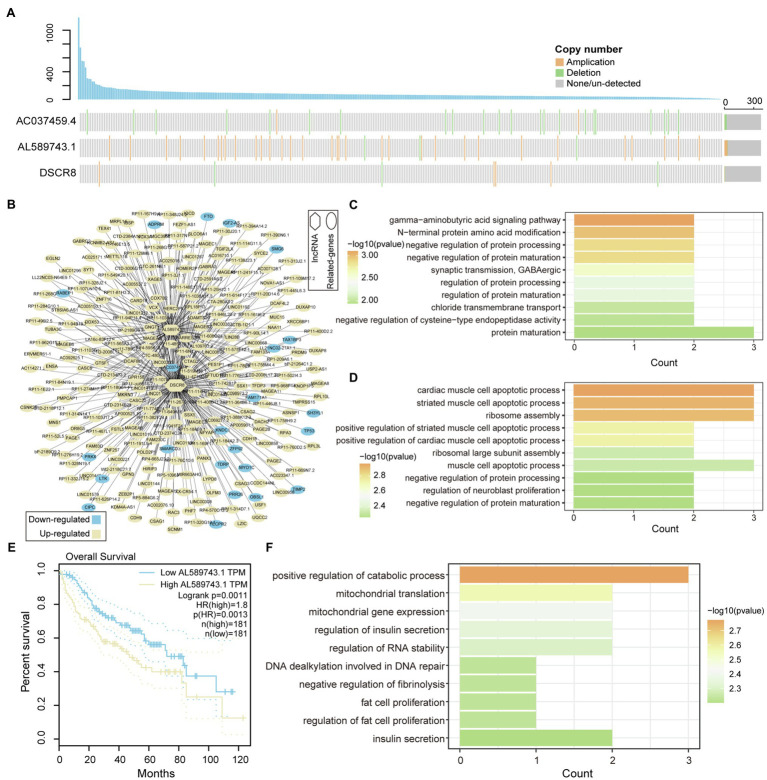
Figure 3.
Functional identification of mutation-driven lncRNA. (A) Waterfall plot illustrates variation types of copy number (amplification, deletion, and none/un-detected) for each sample on lncRNA, including AC037459.4, AL589743.1, and DSCR8. The up-panel shows the number of mutated genes in each sample. (B) The relationship between mutation-driven lncRNA and co-expressed genes is shown by network. Circles represent co-expressed genes with lncRNAs; squares represented mutation-driven lncRNAs. Upregulated genes are marked with yellow; downregulated genes are marked with blue. (C,D) The bar graphs show the GO function enrichment results for genes co-expressed with lncRNA AC037459.4 and AL589743.1. (E,F) Survival difference between the two groups of samples with high and low expression of AL589743.1 and DSCR8. Univariate cox regression algorithm and log-rank test are used to evaluate the relationship between the expression of Md-lncRNA and patient survival.

