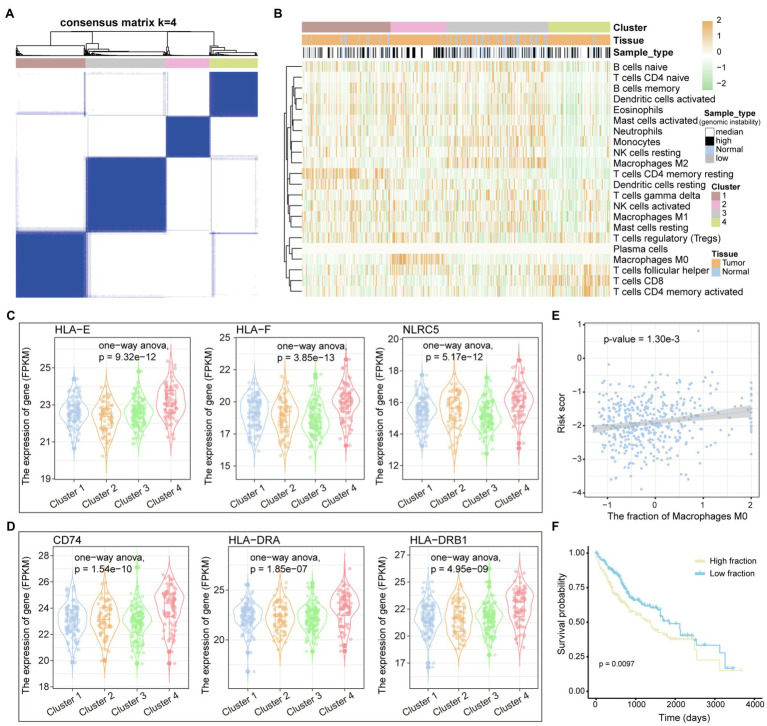
Figure 5.
Immune cell components of LIHC patients. (A) The samples are divided into several clusters based on the immune cell components of each sample. The consistency matrix is drawn as a heat map, and the column labels show the clusters. (B) The 22 immune cell fractions of each sample were displayed by heat map. Column labels, including clusters, tissue origin, and type of variation of samples, are displayed. (C,D) The relationship between genes encoding MHC I and MHC II molecules and clusters defined by immune cell components is shown by boxplot. ANOVA is used to calculate statistical significance. (E) The correlation between the fraction of macrophages M0 and the risk score is shown. (F) KM curves for survival in high and low fraction groups of macrophages M0. Log-rank test is used to calculate statistical significance.

