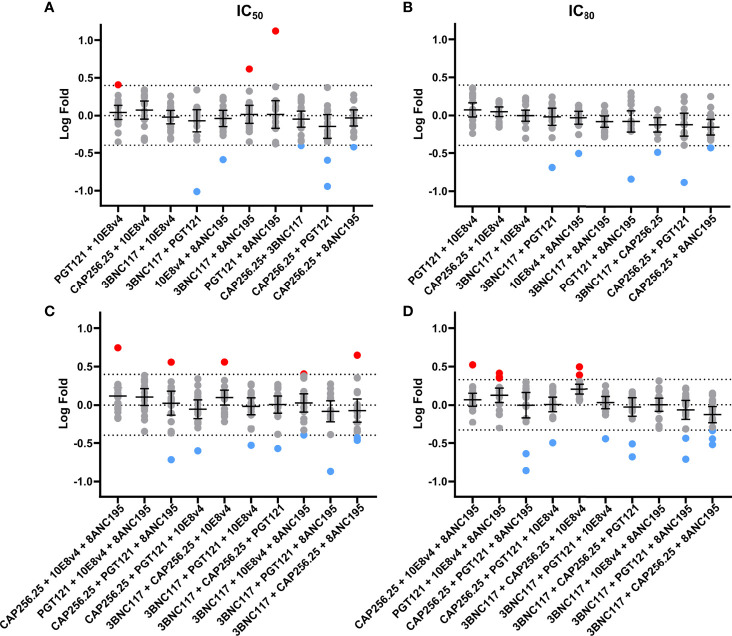
Figure 4.
No synergy observed using fold difference between experimental and Bliss-Hill predictions of dual and triple scFv combinations. Log-fold differences of double and triple IC50 (A, C) and IC80 (B, D) experimental combinations to the Bliss-Hill Independence model prediction. Mean and the 95% confidence interval are shown with a dotted line indicating no fold change. Log (2.5) fold difference dotted lines (0.4 or -0.4) are also shown. Red and blue are used to indicate more than a log difference of 0.4 (~2.5x) with red dots indicating potential synergy and blue dots indicating potential antagonism.

