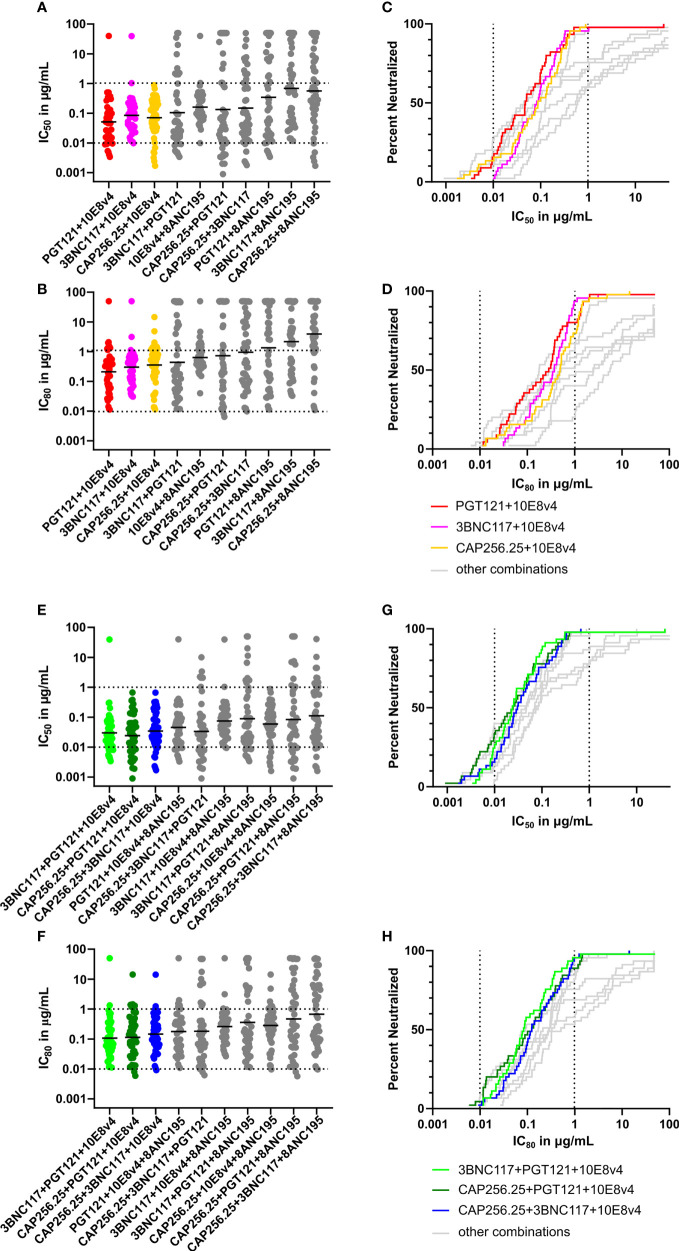
Figure 5.
Predicted breadth and potency of scFv combinations against large virus panel. (A) Scatter plot showing predicted IC50 titers of dual combinations based on single scFv data for a panel of 45 viruses using the Bliss-Hill Independence model. The IC50 data is plotted in μg/mL recalculated from nM based on the formula given in the methods section. (B) Predicted IC80 titers of dual combinations based on the Bliss-Hill Independence model ranked by geometric mean. (C) Breadth-potency curves of IC50 titers of most potent and broad dual combinations were plotted for the IC50.with the others in grey. (D) Breadth-potency curves from IC80 data for the most potent and broad dual combinations. (E) IC50 titers for triple combinations based on the Bliss-Hill Independence model. (F) Predicted IC80 titers for the triple combinations ranked based on geometric mean. (G) Breadth potency curves for the IC50 of the most potent and broad triple combinations are plotted. (H) The breadth-potency curves are based on IC80 titers of the most potent and broad combinations. The maximum neutralization for the IC50 and IC80 data is set at 50μg/mL for all plots. Geometric mean is indicated by a black line in A, C, E, and G Dotted lines are shown at 0.01μg/mL and 1μg/mL for breadth-potency plots IC50 and the IC80 (B, D, F, H). Each scFv is present in the combination at the titer indicated.

