
Figure 2.
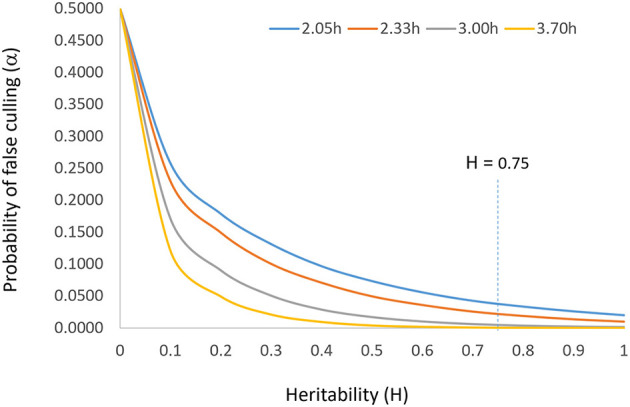
The relationship between heritability (H or h2) and probability of false culling (α) at four levels of selection intensity (i). It is suggested that the probability of false culling that can be tolerated be set according to the population size (n) such that α = 1/n; i can then be determined by α by consulting the normal distribution table. The vertical line of H = 0.75 indicates the target heritability to be achieved for reliable selection.