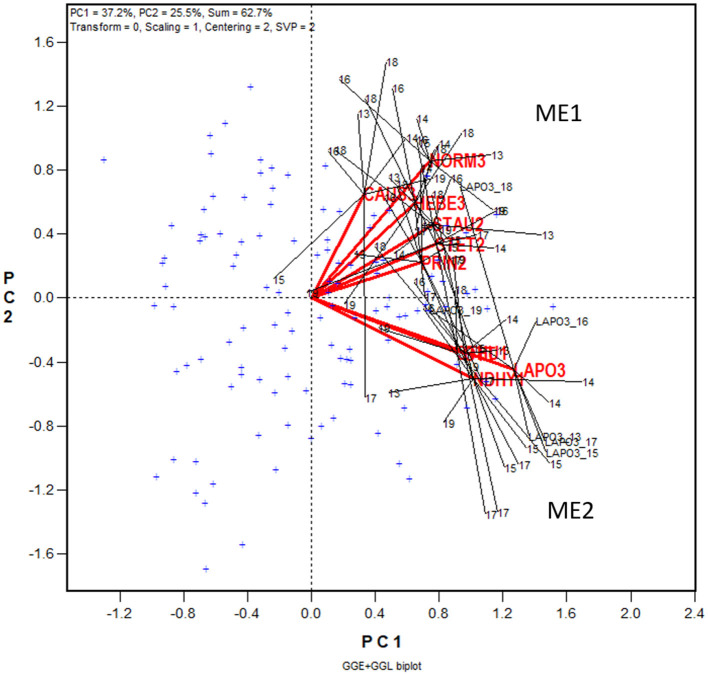
Figure 4.
GGE + GGL biplot modified from Figure 3 to show two groups of locations or oat mega-environments (ME) in Quebec. Mega-environment 1 (ME1) consists of Zone 2 and Zone 3 locations PINT2, PRIN2, STAU2, STET2, CAUS3, HEBE3, and NORM3, and mega-environment 2 (ME2) includes locations NDHY1, STHU1, LAPO3, and OTT. The trials conducted at each location are presented as a cluster of trials, with the location name placed at the center and the individual trials, indicated by the last two digits of the year, placed around it, and the trials are connected to the center with straight lines. Two locations are regarded as belonging to the same mega-environment if their clusters overlap; they are regarded as belonging to different mega-environments otherwise. The variation in the placement of the locations between mega-environments represents repeatable GE and the variation in the placement of the trials within mega-environments represents unrepeatable GE. The genotypes are displayed as “+” in blue for clarity.

