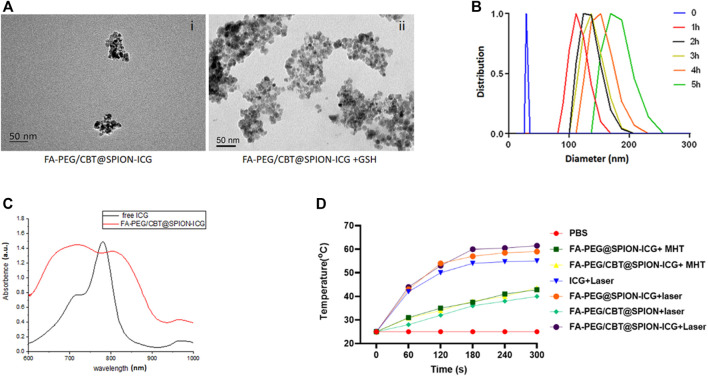
FIGURE 2.
Characterization of FA-PEG@SPION-ICG. TEM images of FA-PEG/CBT@SPION-ICG (i) and FA-PEG/CBT@SPION-ICG after being treated by GSH (ii). DLS diagram of FA-PEG/CBT@SPION-ICG after being treated by GSH (B). UV absorption spectrum of free ICG and FA-PEG/CBT@SPION-ICG (C). In vitro temperature profile (D).

