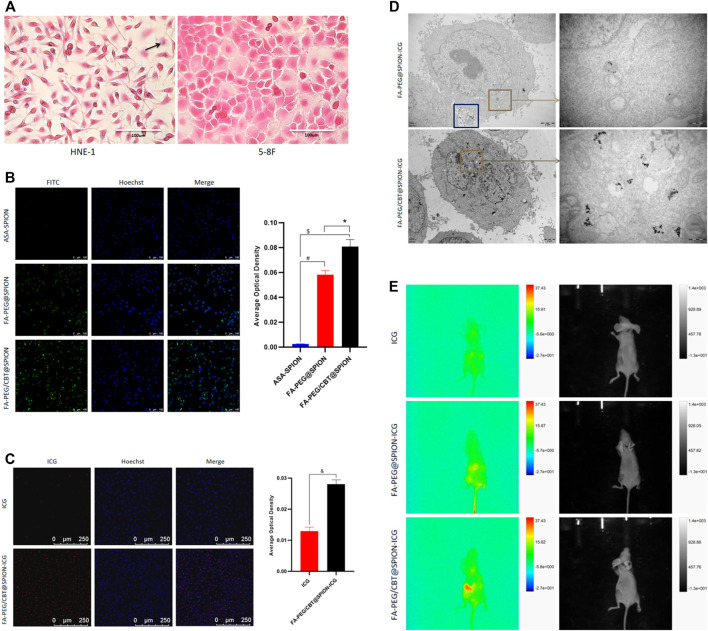
FIGURE 3.
Prussian blue staining (A) and Hoechst staining (B) (C) of different formations under various conditions. #Stands for p < 0.05 ASA@SPION versus FA-PEG@SPION. $ Stands for p < 0.05 ASA@SPION versus FA-PEG/CBT@SPION. * Stands for p < 0.05 FA-PEG@SPION versus FA-PEG/CBT@SPION. & Stands for p < 0.05 ICG versus FA-PEG/CBT@SPION-ICG. TEM results of HNE-1 cells after cellular uptake of FA-PEG@SPION-ICG and FA-PEG/CBT@SPION-ICG (D). Multimodal small animal imaging after injection of different formations at 8 h (E).

