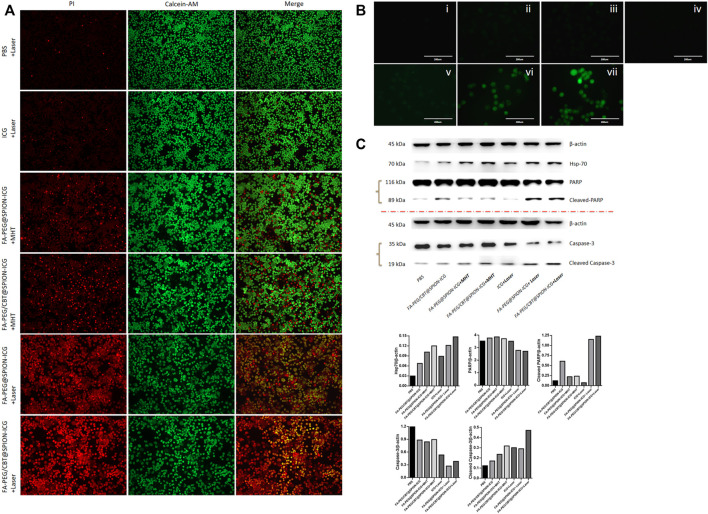
FIGURE 4.
Calcein-AM/PI live/dead cell staining (10 ×) (A), ROS detected by DCFH-DA staining (B), and western blot analysis (C) of different formations under various conditions. In B, i is PBS, ii is FA-PEG@SPION-ICG, iii is FA-PEG/CBT@SPION-ICG, iv is PBS + Laser, v is ICG + Laser, vi is FA-PEG@SPION-ICG + Laser, and vii is FA-PEG/CBT@SPION-ICG + Laser.

