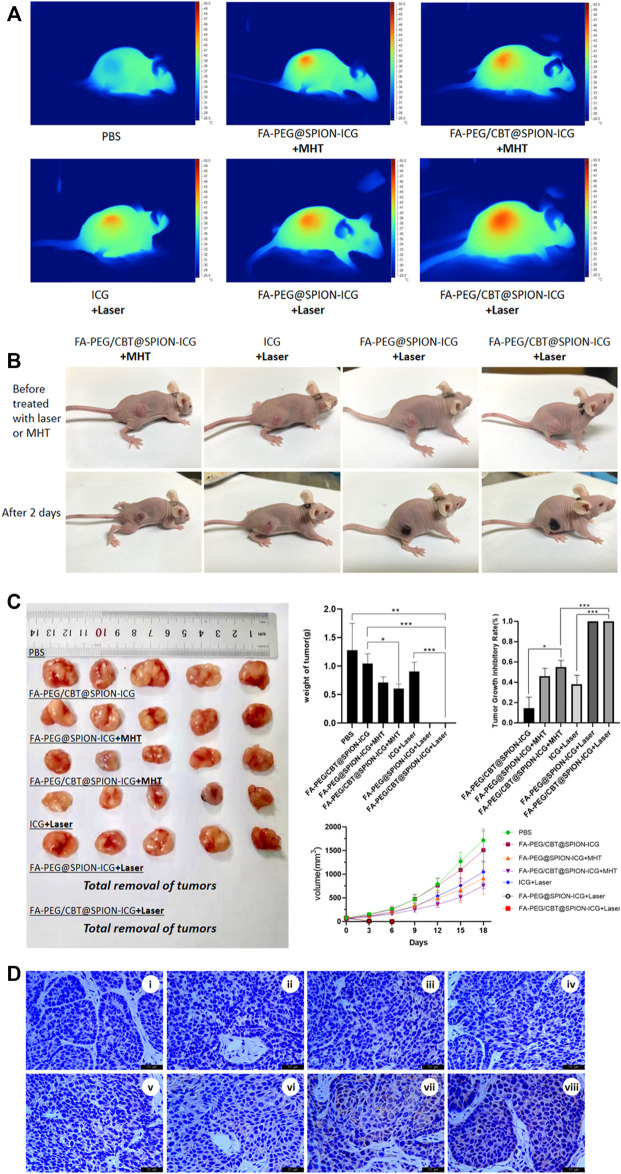
FIGURE 5.
Thermal imaging of the mice after treatment with different formulations with NIR or MHT (A). Imaging was performed before and on day 2 after the different treatments (B). Tissues dissected from nude mice, mass histogram of the tumor weight, mass histogram of the tumor growth inhibition rate, and a line graph of tumor tissue volume over time (C) (N = 5) (*) p < 0.05 (**) p < 0.01 (***) p < 0.001. Immunohistochemical analysis of Hsp70 expression in different groups (D). Figure 4D, i is PBS, ii is PBS + Laser, iii is FA-PEG/CBT@SPION-ICG, iv is FA-PEG@SPION-ICG + MHT, v is FA-PEG/CBT@SPION-ICG + MHT, vi is free ICG + Laser, vii is FA-PEG@SPION-ICG + Laser, and viii is FA-PEG/CBT@SPION-ICG + Laser.

