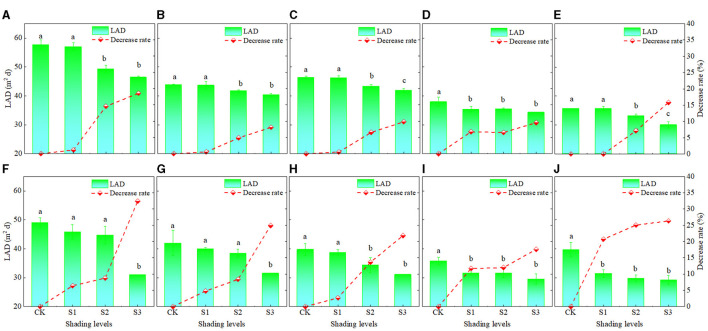
Figure 4.
The leaf area duration (LAD) and after silking under different shading levels and planting densities treatments and the decrease rate in LAD under each shading treatment compared to the CK. (A–E) show the cultivar XY335 results at densities D1, D2, D3, D4, and D5, respectively, and (F–J) show the ZD958 results at the same densities. See Figure 1 for planting density and shading treatment definitions. Different lowercase letters of the same cultivar above the columns show significant differences between each shading treatment for each planting density at P < 0.05.

