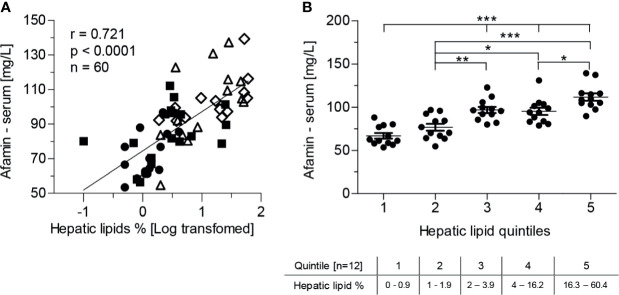
Figure 2.
Serum afamin concentrations and hepatic lipid content, measured by 1H-MR spectroscopy (study 1). (A) Serum afamin correlates positively with hepatic lipids (Pearson linear correlation) (B) Stratification of the study population into quintiles according to hepatic lipid content. Data are presented as mean ± SEM. *p < 0.05; **p < 0.01; ***p < 0.001; 1-way ANOVA followed by Tukey post-hoc test;  lean-healthy; ■ obese-healthy; Δ obese -prediabetes,
  obese - type 2 diabetes.

