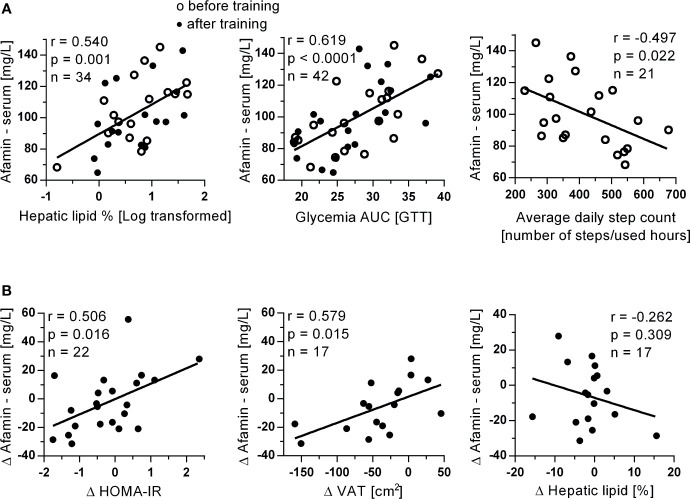
Figure 3.
Associations of (A) serum afamin concentrations with hepatic lipids, glycemia AUC and average daily steps count determined during the entire 12-week exercise intervention in study 2. Associations of (B) changes in serum afamin concentrations and changes in clinical parameters, induced by the 3-month exercise training intervention. Δ: value after training intervention (trained) – value before training (untrained); AUC, area under the curve; HOMA-IR, index of insulin resistance; oGTT, oral glucose tolerance test; VAT, visceral adipose tissue (assessed by MRI); Pearson linear correlation.

