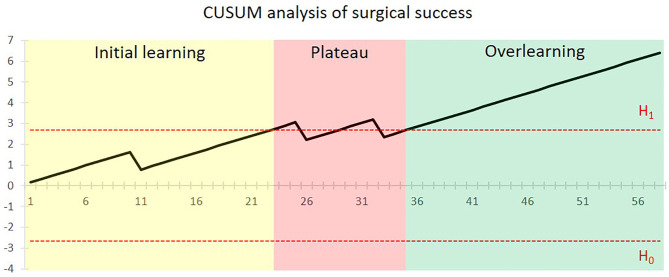
Figure 1.
CUSUM analysis of surgical success for the CAJR with PSSP performed by the surgical team. The x-axis shows the chronological sequence of cases. The black line indicates the cumulative sum of surgical success. The horizontal red dotted lines represent the acceptable boundary line H1 and unacceptable boundary line H0. Proficiency was first achieved after 35 cases.

