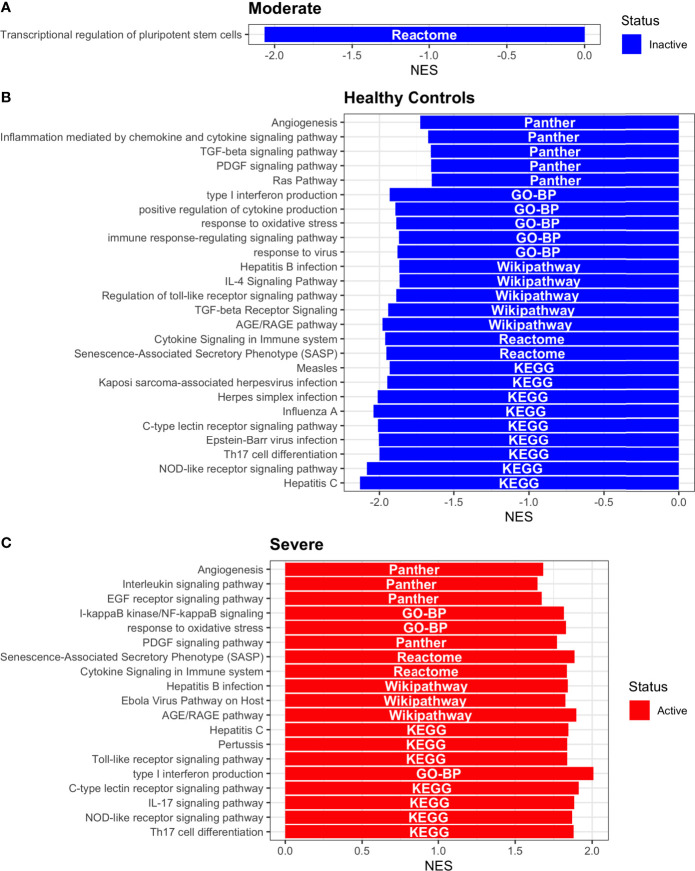
Figure 14.
Pathway Enrichment Analysis across various databases. Activity status of the TFs in a particular pathway found by DoROthEA across the disease severity in Neutrophils. (A) GSEA in moderate patients. (B) GSEA in healthy controls. (C) GSEA in severe patients. The normalized enrichment score (NES) value represents the activity status within the disease severity conditions, a positive value for active pathways (red), and a negative value for inactive pathways (blue). The dataset for every pathway (rows) is indicated inside the colored bar.

