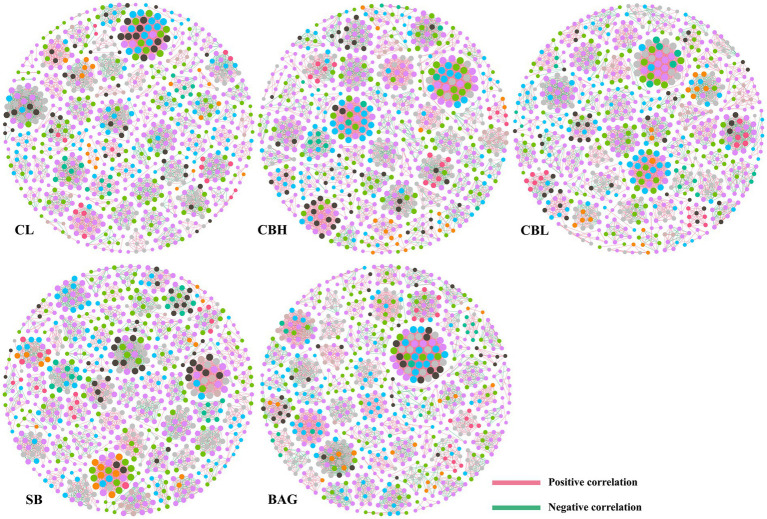
Figure 5.
Co-occurrence networks of microbial communities at OTU level. A connection stands for a very strong (Spearman’s R>0.6) and significant (FDR-adjusted p<0.05) correlation. The size of each node is proportional to the relative abundance; the thickness of each connection between two nodes (edge) is proportional to the value of Spearman’s correlation coefficients. Pink lines represent significant positive correlations, and green lines denote negative correlations.

