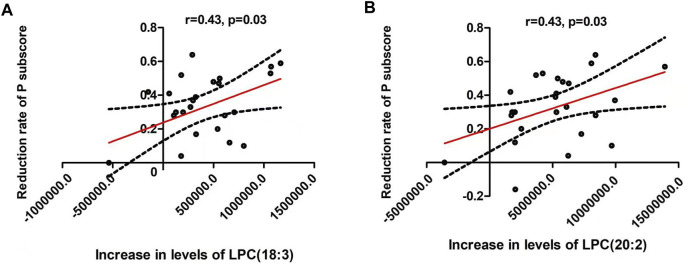
FIGURE 2.
There were significant positive associations between the reduction of positive symptoms and the increase of lysophosphatidylcholine (LPC) (18:3) (A) and LPC(20:2) (B) (both were: r = 0.43, p = 0.03). The red line represents the trend line, and the dashed black line is the 95% confidence interval.

