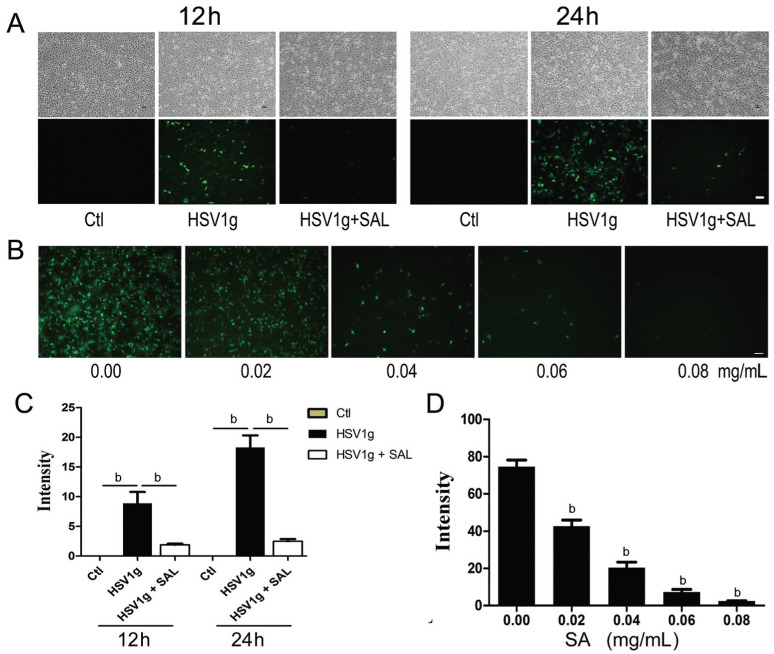
Figure 3. SAL inhibits HSV1g infection in a dose-dependent manner and HCE cell lines were infected with HSV1g.
A: Comparison of the inhibitory effects of SAL at 12 and 24h. The control group (Ctl) consisted of cells without virus infection and with SAL treatment. B: HSV1g-infected HCE cells were incubated with 0, 0.02, 0.04, and 0.08 mg/mL SAL for 24h. Images of GFP fluorescence were obtained. C: Comparison of GFP fluorescence intensities in A. bP<0.01. D: Average fluorescence intensities calculated from B. bP<0.01 vs HSV1g infected cells without SAL. All photograms were obtained at the same magnification (scale bar=50 µm). Each experiment was repeated at least three times.

