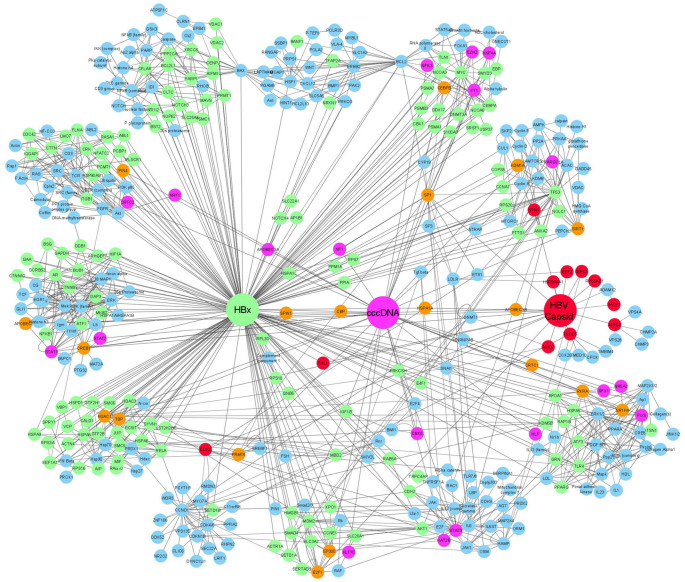
FIGURE 2.
Gene association network showing the relationship between HBx, HBc, and HBV cccDNA interacting proteins. In the network, proteins which only interact with HBx are indicated in green, proteins which only interact with cccDNA are shown in pink, and proteins that only interact with HBc are shown in red. Proteins that were shown to interact with more than two of the founding nodes (cccDNA, HBc, and HBx) are depicted in orange. proteins that were extrapolated to connect to one or more interacting proteins are shown in blue.

