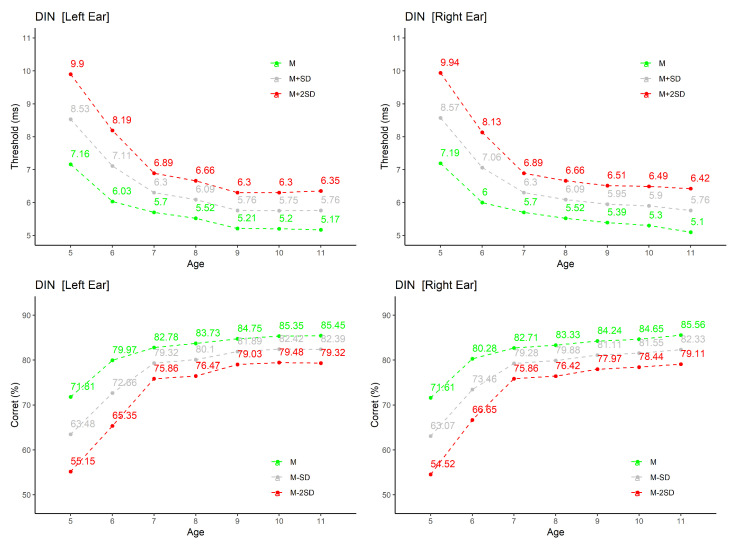
Figure 6.
Results for Detection of Interval in Noise test: top row presents the hearing thresholds (in ms) by age group and ear; bottom row the percentage of correct answers also by age group and ear. In addition to the average value (M), M + 1SD and M + 2SD are shown for the threshold and M − 1SD and M − 2SD for correct answers.

