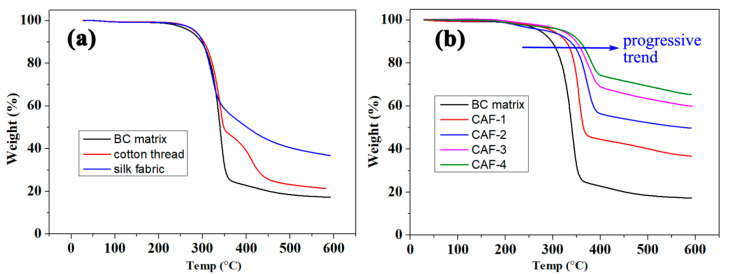
Figure 7.
(a) Thermogravimetry analysis (TGA, 10 °C min−1 heating) curves of BC matrix, cotton thread, and silk fabric. (b) Thermogravimetry analysis (TGA, 10 °C min−1 heating) curves of BC matrix and CAFs. The blue arrow shows the temperature changes of each material at the same change in weight proportion (88%).

