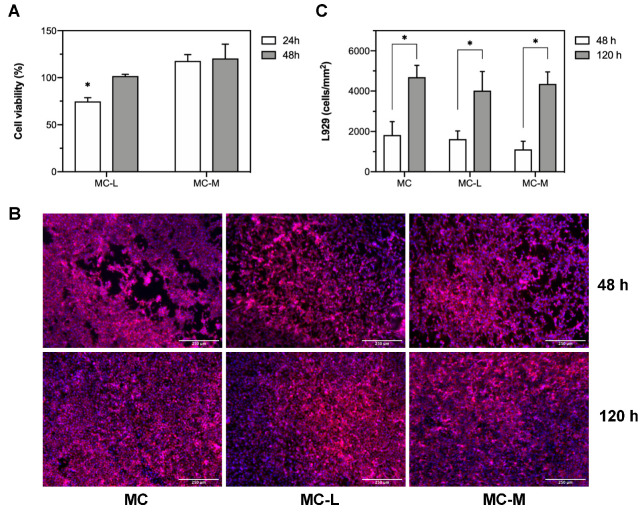
Figure 4.
(A) L929 metabolic activity on MC hydrogels after culture for 24 and 48 h. MC was used as control. * = p < 0.05 compared to MC control; (B) fluorescence micrographs of L929 CSs detached from MC, MC-L, and MC-H hydrogels, 48 and 120 h after seeding. Scale bar = 250 μm; (C) cell density (cells/mm2) calculated from image analysis, for MC, MC-L, and MC-H hydrogels, 48 and 120 h after seeding. * = p < 0.05.

