
Figure 2. Clinical Outcomes.
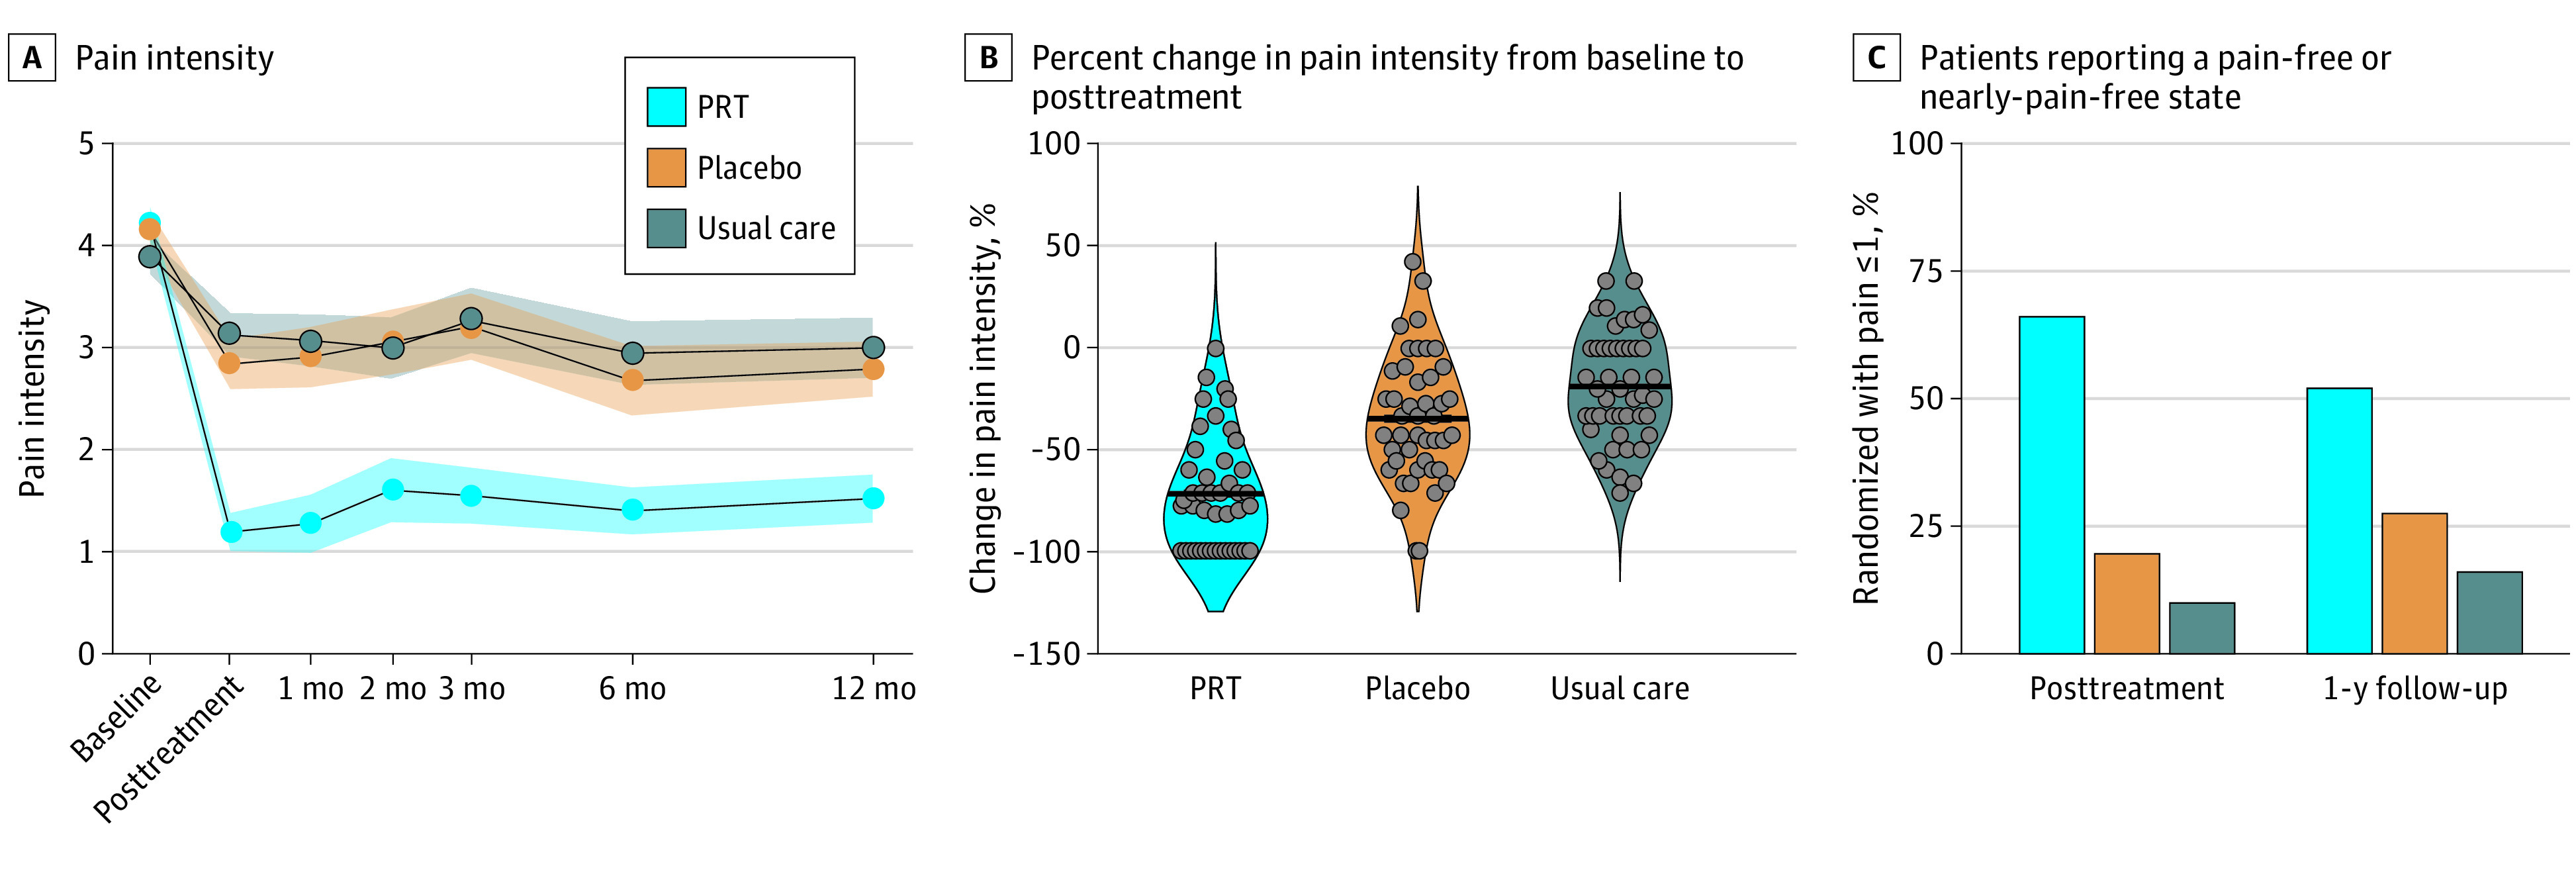
A, Shading indicates standard error. B, Dots represent individual participants; thick lines represent the group mean. C, Percentage of patients reporting pain scores of 0 or 1 of 10 (ie, pain-free or nearly pain-free) at posttreatment and at 1-year follow-up. PRT indicates pain reprocessing therapy.