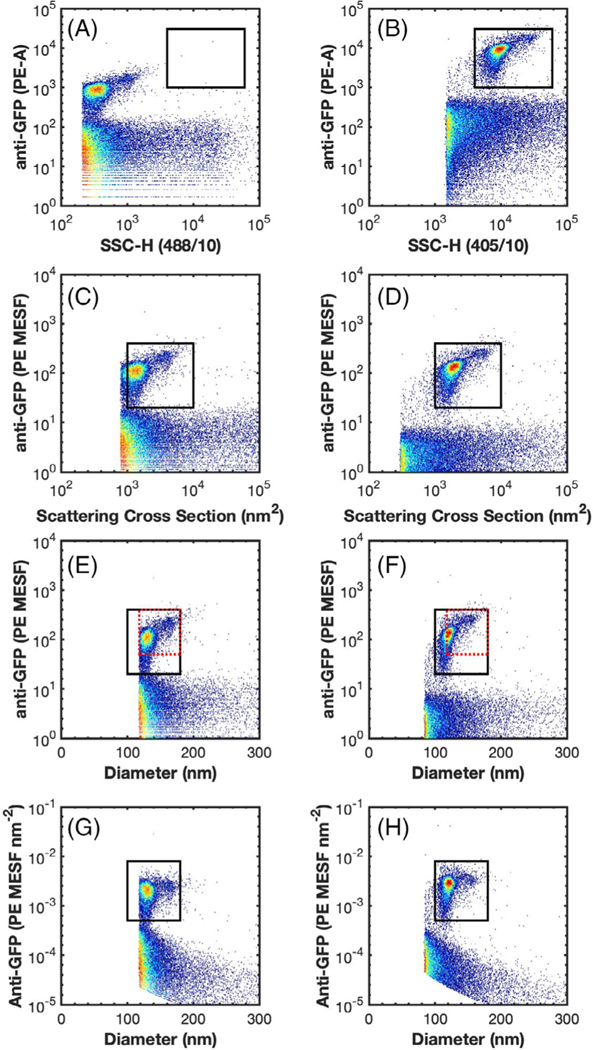
Fig 1.
Representative data demonstrating the comparability of uncalibrated and calibrated data across flow cytometers. (A and B) the side scatter versus anti-GFP-PE fluorescence of MV-MsfGFP are shown on the LSR Fortessa and CytoFLEX S, respectively. A comparison gate is drawn from 4 × 10³ to 6 × 10⁴ SSC-H and 1 × 10³ to 3 × 10⁴ PE-A. (C and D) the scatter cross section versus anti-GFP-PE (MESF) of MV-M-sfGFP are shown on the LSR Fortessa and CytoFLEX S, respectively. A comparison gate is drawn from 1 × 10³ to 1 × 10⁴ nm2 and 20 to 400 PE MESF. (E and F) the diameter (nm) versus anti-GFP-PE (MESF) of MV-M-sfGFP are shown on the LSR Fortessa and CytoFLEX S, respectively. A comparison gate is drawn from 100 to 180 nm to and 20 to 400 PE MESF (black). A second comparison gate is drawn from 118 to 180 nm to and 50 to 400 PE MESF (red dotted). (G and H) the diameter (nm) versus anti-GFP-PE (MESF nm−2) of MV-M-sfGFP are shown on the LSR Fortessa and CytoFLEX S, respectively. A comparison gate is drawn from 100 to 180 nm to and 5 × 10⁻⁴ to 8 × 10⁻³ PE MESF nm−2 (black).

