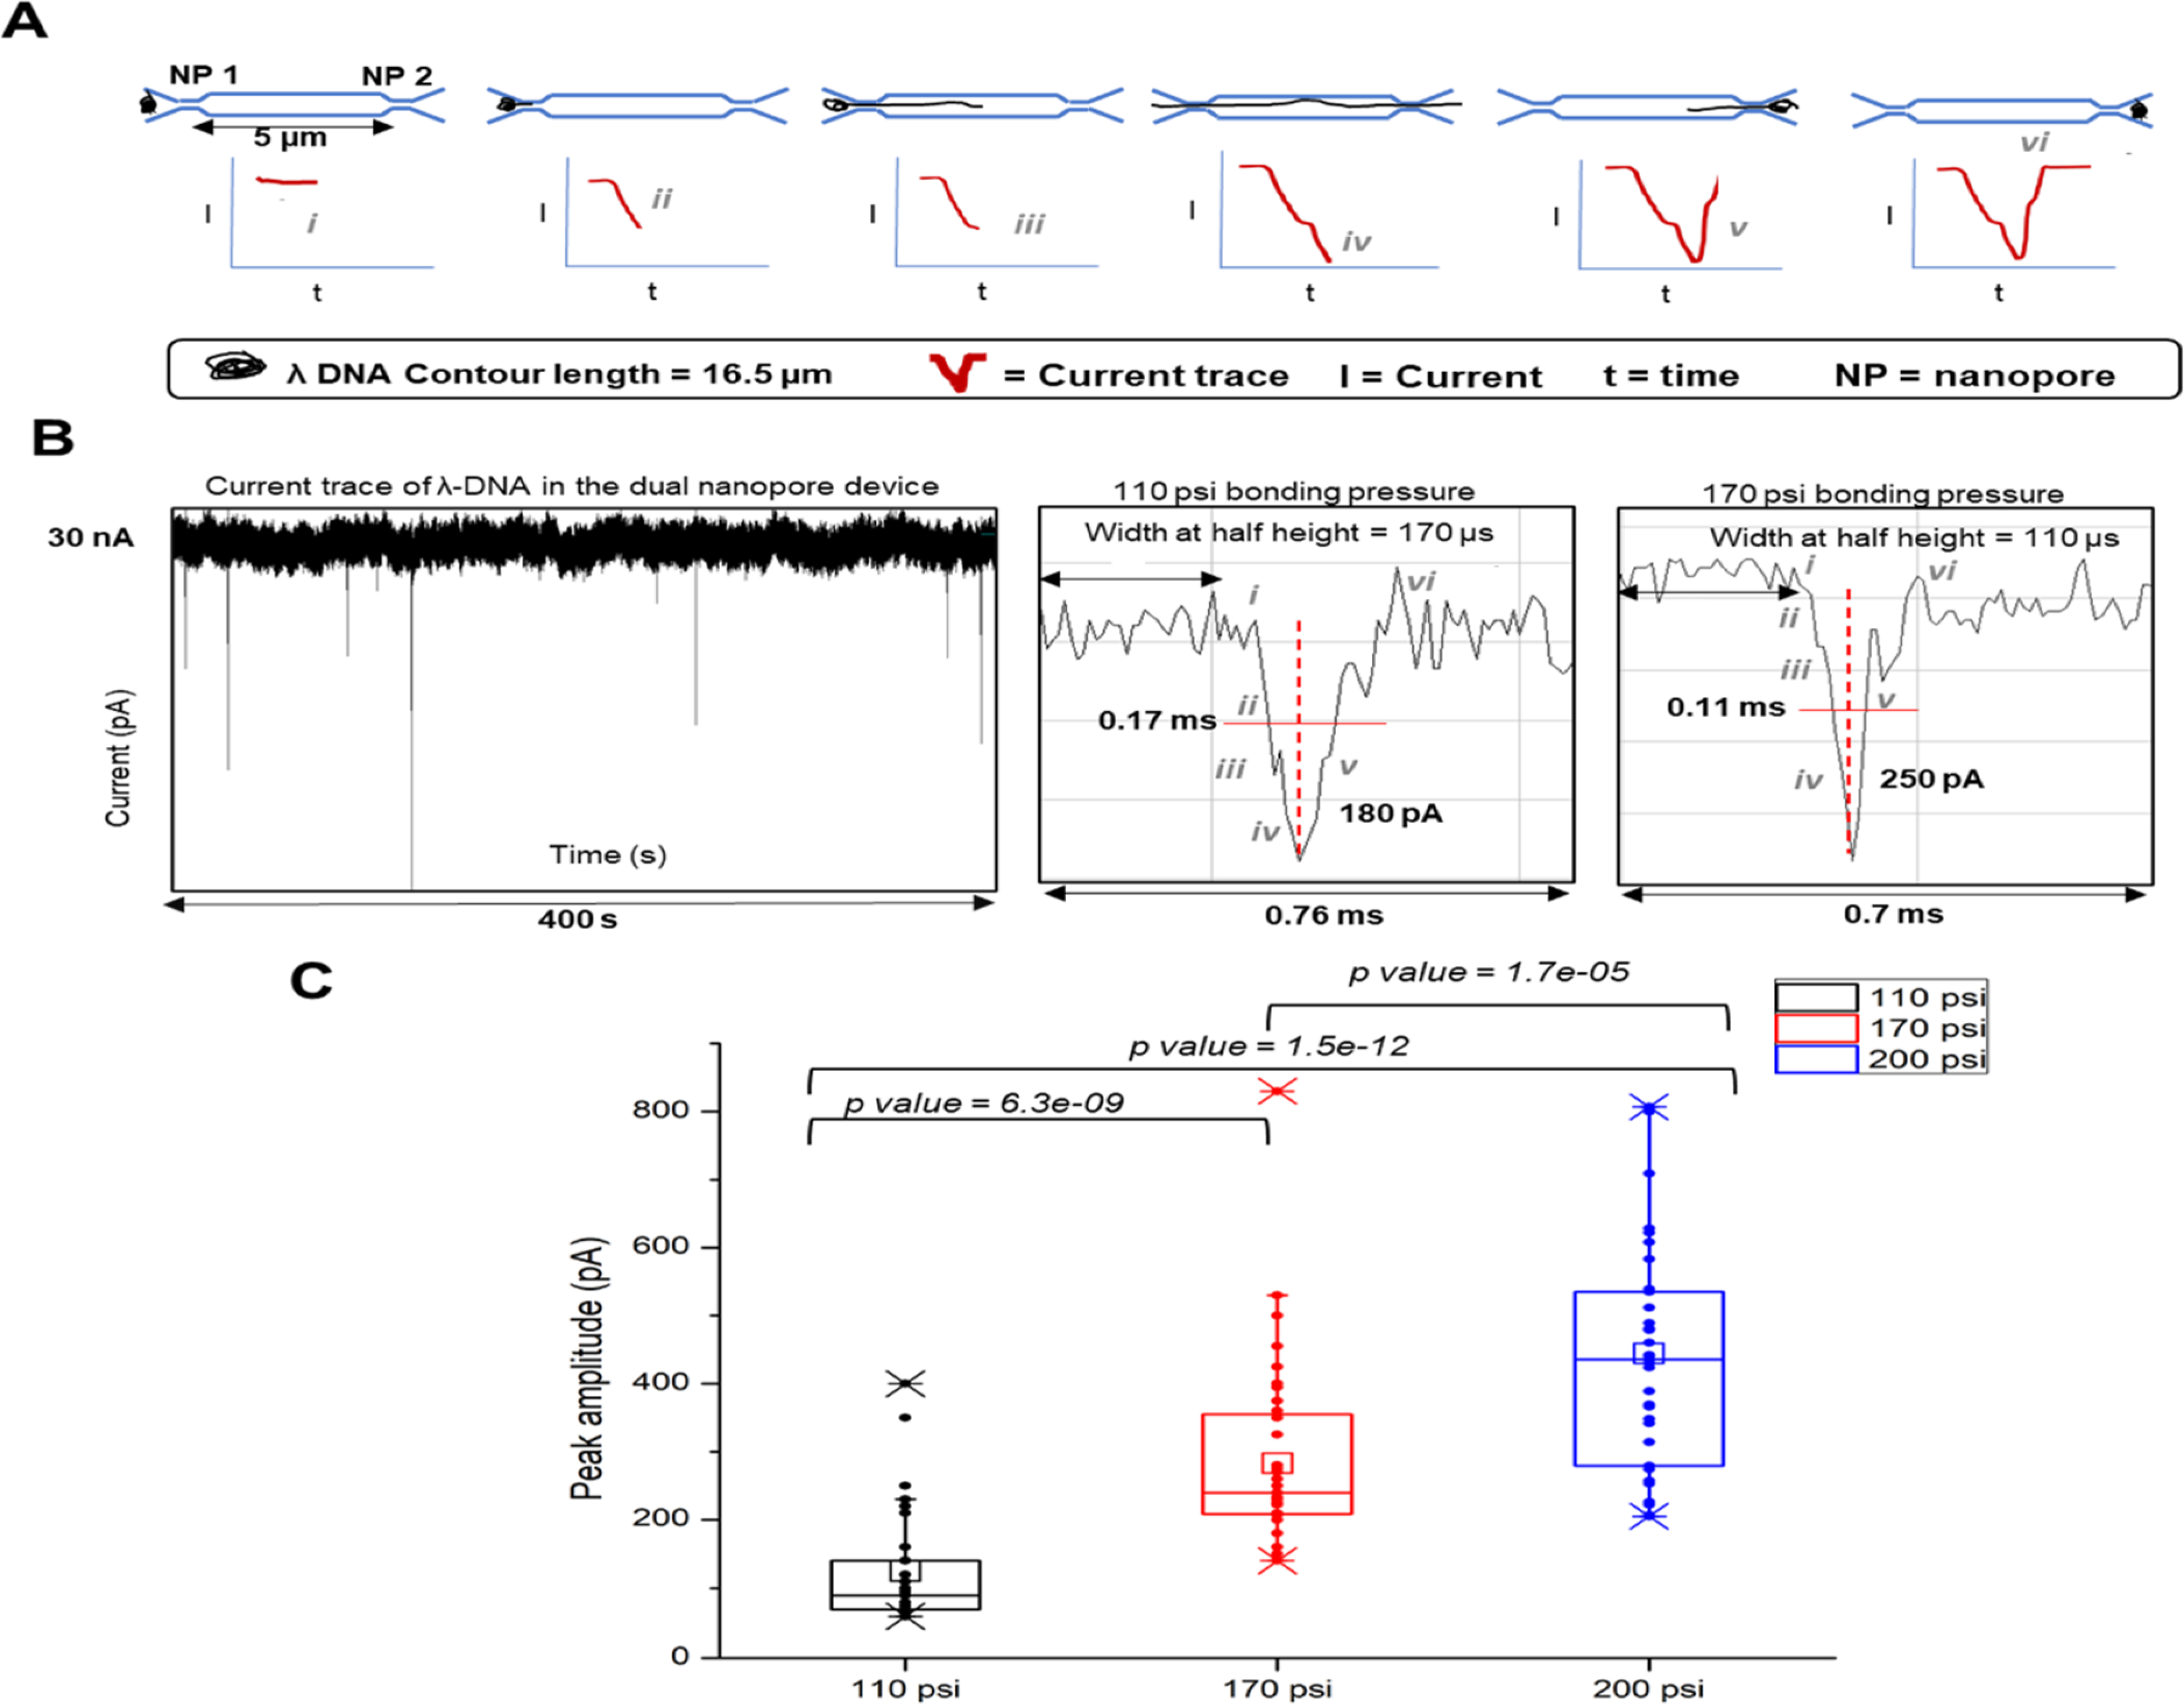
Figure 3.

λ-DNA translocation through the dual in-plane PMMA nanopores and the ramifications of the size of the nanopore on peak amplitude. (A) Schematic of the λ-DNA translocation through the in plane dual nanopore device that gives rise to a negative peak as the DNA enters the first pore. Since the contour length of the DNA is longer than both the pores, there is a second subsequent peak when the DNA coresides in both the pores. The DNA then leaves the pores very quickly which makes the current return to the baseline. (B) Detected current transient trace typically observed in a time interval of 400 s as a result of λ-DNA translocation and magnified images of individual peak shapes at various translocation stages of the DNA through the dual nanopore at 110 and 170 psi pressure, respectively. (C) Distribution of peak amplitudes of λ-DNA at 110, 170, and 200 psi bonding pressures. The average peak amplitude increases with the increasing bonding pressure. p values calculated between each bonding pressure condition (Wilcoxon signed rank test) show statistically a significant difference at 95% confidence interval (p < 0.05).
