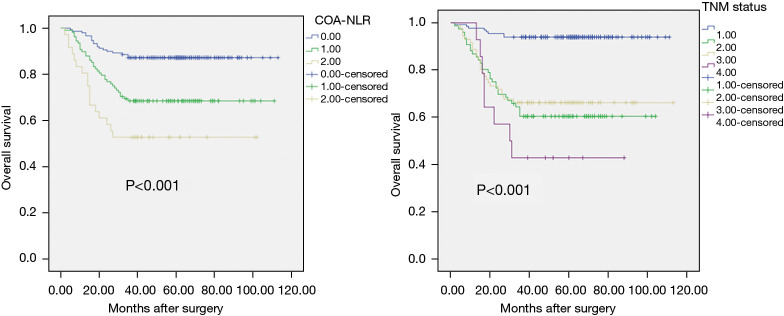
Figure 1.
A schematic representation of the Kaplan-Meier graph: OS according to COA-NLR (left) and OS according to TNM status (right) in lung cancer patients undergoing surgery. OS, overall survival; COA-NLR, combination of albumin concentration and neutrophil-to-lymphocyte ratio; TNM, tumor-node-metastasis.

