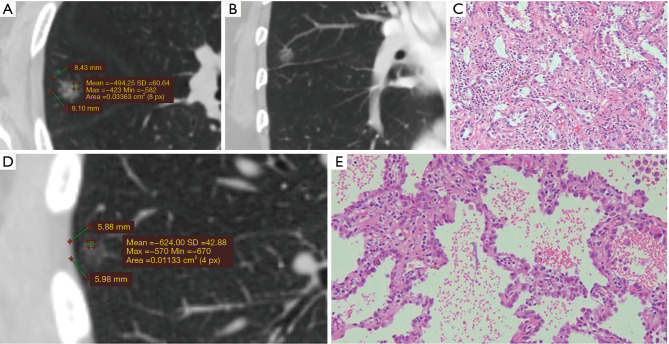
Figure 3.
Typical IAC prediction results for two lung pGGNs under this model: one high IAC possibility and one low IAC possibility. (A) PGGN No. 1: 9.10×8.43 mm in size with a maximum CT value of −423 HU; the predicted IAC possibility was 0.47 (cut off: 0.42); (B) typical “vessel curve” of pGGN No.1; (C) pathological result of pGGN No. 1: IAC of acinar type (HE ×200); (D) pGGN No. 2: 5.98×5.88 mm in size with a normal vessel and a maximum CT value of −570 HU; the predicted IAC possibility was 0.02 (cut off: 0.42); (E) pathological result of pGGN No. 2: AIS (HE ×200). IAC, invasive adenocarcinoma; pGGNs, pure ground-glass nodules; CT, computed tomography; HU, Hounsfield unit; AIS, adenocarcinoma in situ.

