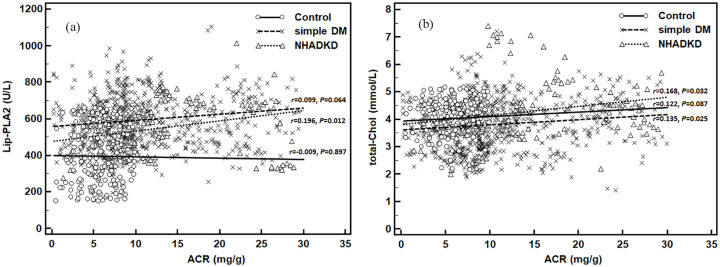
Figure 2.
Correlation between Lip-PLA2/total-Chol and ACR levels in different groups.
Note. Control: healthy controls; simple DM: simple diabetes mellitus (ACR < 30 mg/g); NHADKD: non-high albuminuria diabetic kidney disease. (a): Correlation between Lip-PLA2 and ACR; (b): Correlation between total-Chol and ACR. Increased serum Lip-PLA2 or total-Chol level was weakly correlated with increased urinary ACR levels in different groups.

