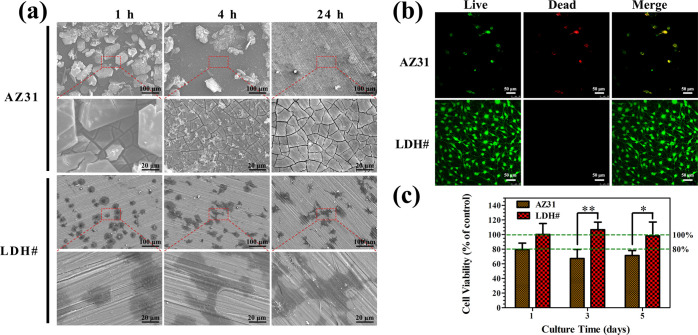
Figure 3.
SEM images of MC3T3-E1 after being cultured on AZ31 and LDH# samples for 1, 4, and 24 h (a); live/dead staining images of MC3T3-E1 after being cultured on AZ31 and LDH# for 3 days (b), green represents living cells and red represents dead cells; and cell viability of MC3T3-E1 after being cultured in the extracts of AZ31 and LDH# for various durations (c).

