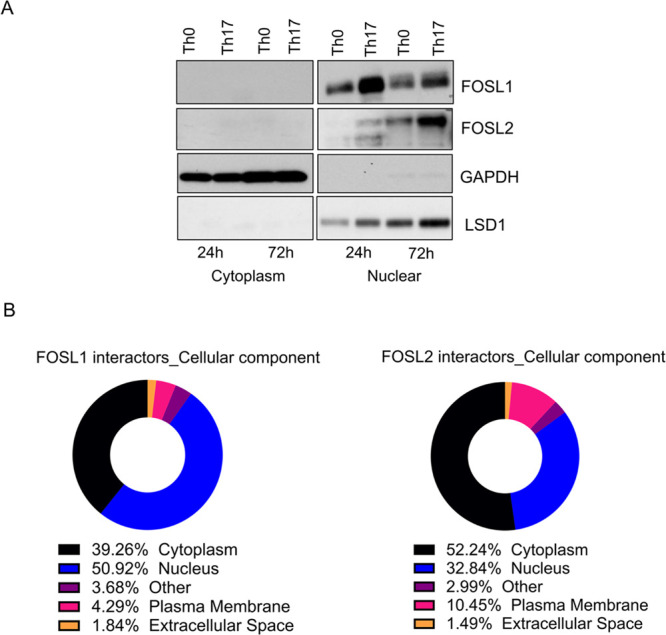
Figure 3.

Localization of FOSL proteins and cellular distribution of their binding partners. (A) Following subcellular fractionation of Th0 and Th17 cell lysates (24 and 72 h), IB was performed to detect FOSL1 and FOSL2 in the fractionated samples. LSD1 and glyceraldehyde-3-phosphate dehydrogenase (GAPDH) were used to mark the nuclear and cytoplasmic fractions, respectively. Representative blot for three biological replicates is shown. (B) Pie charts showing classification of FOSL1 (left) and FOSL2 (right) interacting proteins based on their cellular localization, using IPA.
