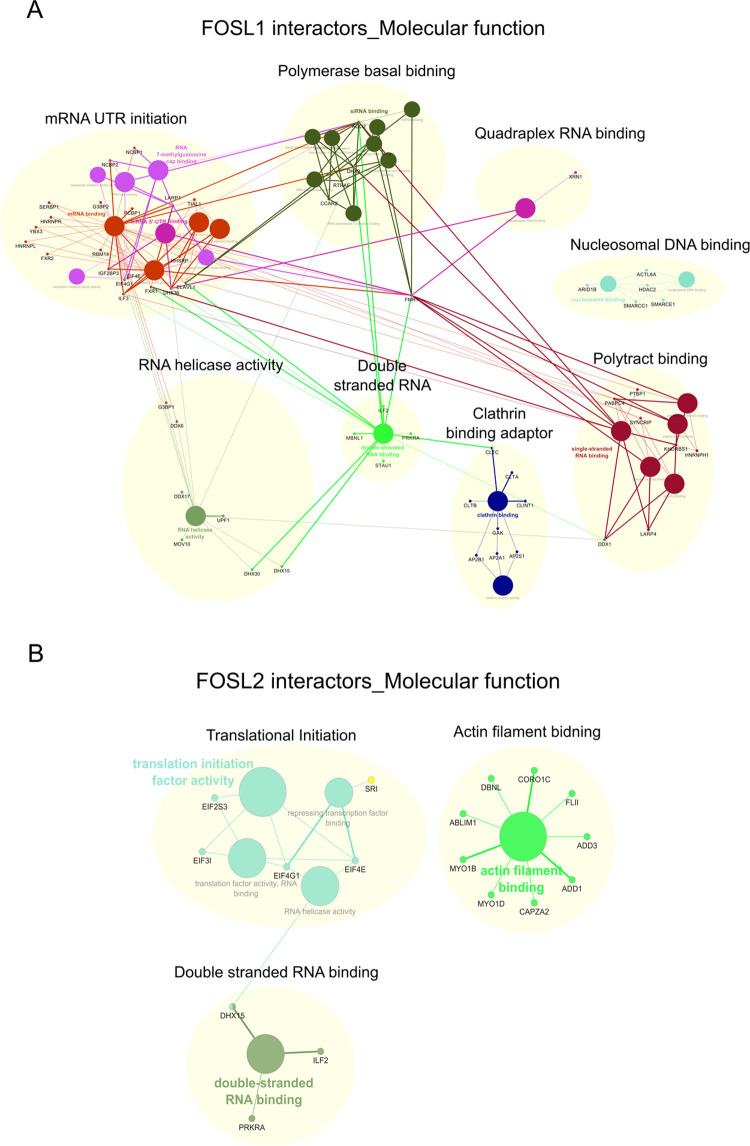
Figure 4.
Molecular function networks enriched for FOSL1 and FOSL2 interactors. (A,B) FOSL1 (panel A) and FOSL2 (panel B) interactors were clustered based on their molecular functions and the resulting networks were visualized using ClueGO and CluePedia plugins built in Cytoscape (Bonferroni step-down corrected p values <0.05).

