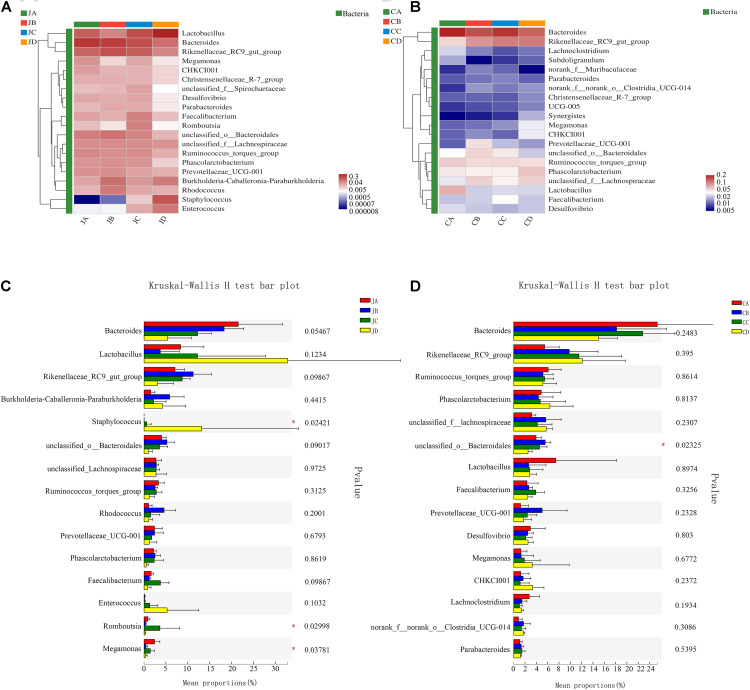
FIGURE 5.
Heatmap chart of the top 20 genera in different intestinal segments (A: jejunum; B: cecum) and comparison of differences between groups of the top 20 phyla (C: jejunum; D: cecum). One-way analysis of variance, JA, jejunum of 0% HILM; JB, jejunum of 1% HILM; JC, jejunum of 3% HILM; JD, jejunum of 5% HILM; CA, cecum of 0% HILM; CB, cecum of 1% HILM; CC, cecum of 3% HILM; CD, cecum of 5% HILM.

