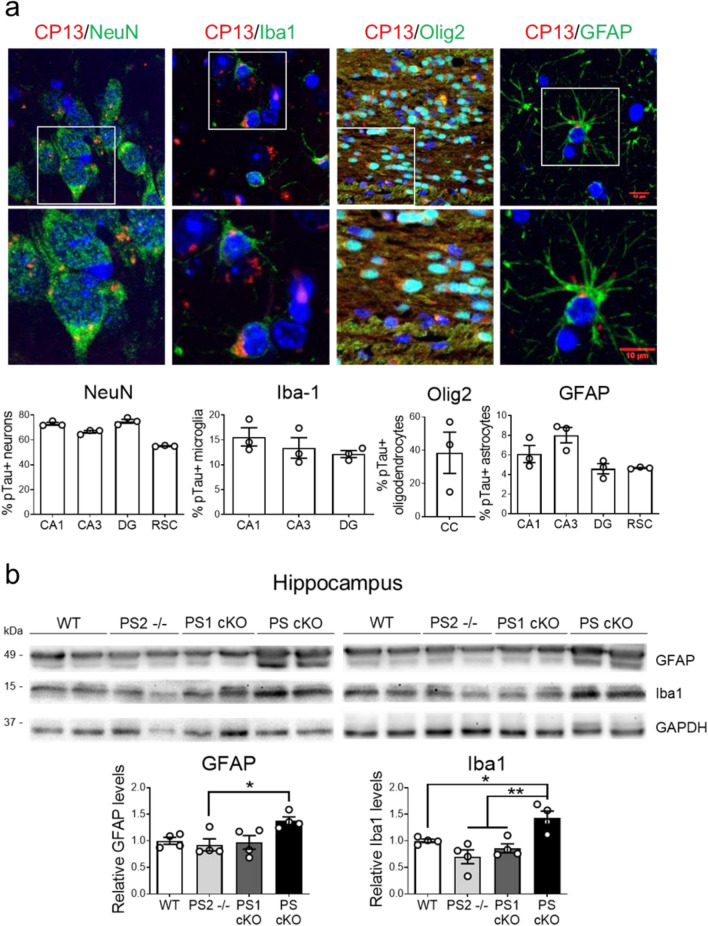
Fig. 4.
Inflammatory responses and accumulation of pathological tau in neurons and glial cells in PS cKO mice. a Representative immunohistological images and quantification (% of positive cells) showing accumulation of phosphorylated tau (CP13: Ser202, red) in neurons (NeuN, green), microglia (Iba1, green), oligodendrocytes (Olig2, green) and astrocytes (GFAP, green) of PS cKO mice at 12 months. Scale bar: 10 µm. Data represent percentage of pTau-positive cells ± s.e.m. (n = 3 mice/group, n = 5 sections/mouse). b Inflammatory responses in PS cKO mice. Western blot images (top) and quantitative analysis (bottom) of GFAP, Iba1 and GAPDH in control (WT), PS1 cKO, PS2−/− and PS cKO mice at 9 months of age. Protein levels were normalized to GAPDH. Data represent relative fold levels ± s.e.m. (n = 4 mice/group). Statistical analysis was determined by one-way ANOVA followed by Tukey’s post hoc test. *P < 0.05, ** P < 0.001 compared to the indicated group

