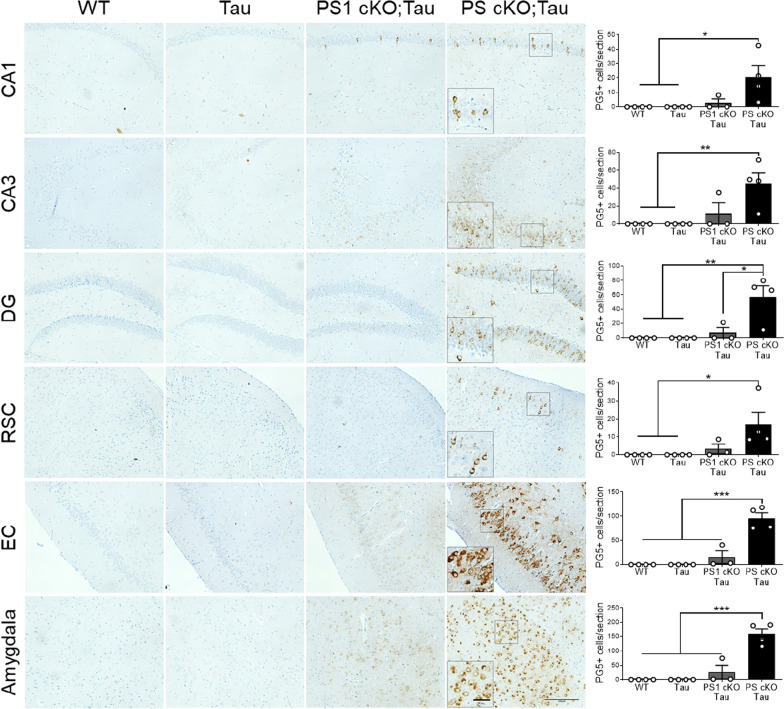
Fig. 6.
Increased pathological PKA-mediated tau phosphorylation in Tau mice lacking PS. Left: Representative immunohistochemical images of phosphorylated tau (PG5: pSer409) in 6 month-old non- and tau transgenic mice. Inset: magnified images showing somatic PG5 staining in PS cKO;Tau brains. Scale bar: 100 μm. Right: Quantitative analysis of number of PG5-positive cells/section in the indicated brain region in littermate control (WT), Tau, PS1 cKO;Tau and PS cKO;Tau mice. Values represent mean PG5-positive cells ± s.e.m. (3 slices per mouse, 4–5 mice/group). Statistical analysis was determined by two-way ANOVA followed by Tukey’s post hoc tests. *P < 0.05, **P < 0.01, ***P < 0.001. Abbreviations: Amygdala: basolateral amygdala; CA1/CA3 hippocampus; DG, dentate gyrus; EC, entorhinal cortex; RSC, retrosplenial cortex

