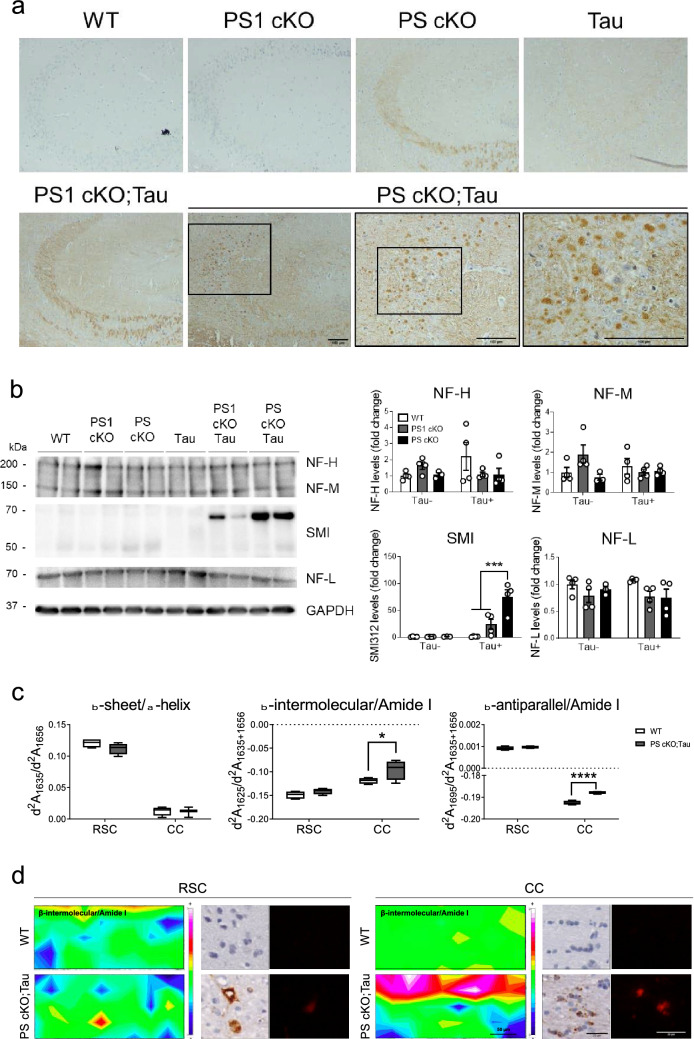
Fig. 8.
PS deficiency causes abnormal NF levels and pathological β-sheet protein structures. a Representative immunohistological images of NF-L in the hippocampus of 6 month-old WT, PS1 cKO, PS cKO, Tau, PS1 cKO;Tau and PS cKO;Tau mice. Insets: magnified images indicated by squares showing prominent NF-L somatic staining in hippocampal neurons of PS cKO;Tau mice. Scale bar = 100 μm. b Left: Biochemical analysis of hippocampal lysates using SMI312 (NF-M/H) and NF-L antibodies. Right: Quantification of NF-H (~ 200 kDa), NF-M (~ 150 kDa), SMI-labeled (~ 60–70 kDa) and NF-L (~ 70 kDa) bands in independent membranes. Protein levels were normalized to GAPDH. Values represent mean ± s.e.m. (n = 4 mice/group). Statistical analysis was determined by two-way ANOVA followed by Tukey’s post hoc tests. ***P < 0.001. c Synchrotron-based µFTIR analysis of the retrosplenial cortex (RSC) and corpus callosum (CC) of WT and PS cKO;Tau mice at 6 months of age. Second derivative absorbances (d2A) of β-sheet/α-helix (d2A1635/d2A1656), and β-intermolecular/Amide I (d2A1625/d2A1635+1656) and β-antiparallel/Amide I (d2A1695/d2A1635+1656) protein structures. Values represent the minimum, the maximum and the median of the average of 100 spectra/mouse (n = 4 mice/group). Statistical analysis was determined by one-way ANOVA followed by Sidak’s post hoc tests. *P < 0.05, ***P < 0.001, ****P < 0.0001. d Representative infrared heat maps of β-intermolecular/Amide I (left images; scale bar = 50 μm) and consecutive immunohistological sections of aggregated tau detected by MC1 staining (middle images) and Congo red staining (right images; scale bar = 25 μm) in the RSC and CC of WT and PS cKO;Tau mice.

