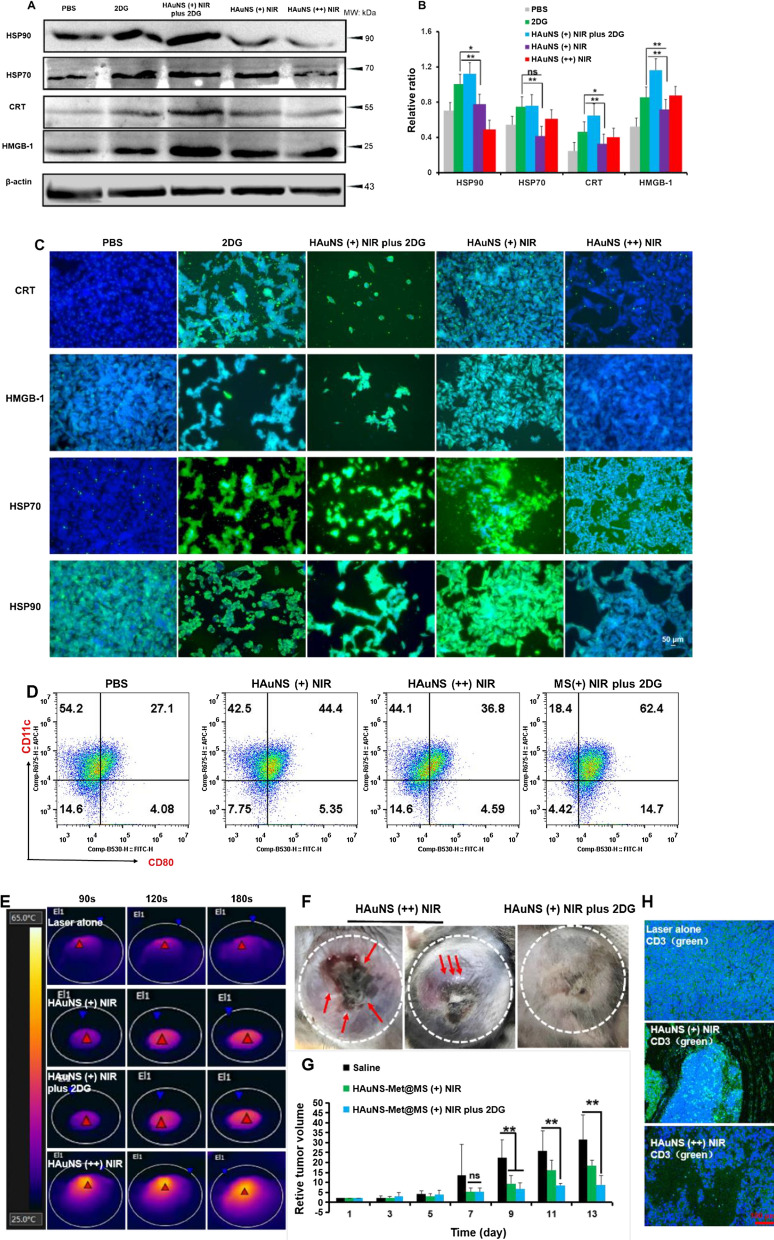
Fig. 3.
Enhancement of tumor cell ICD and reversion of thermotolerance in vivo. Western blotting (A) and its quantitation (B) of DAMPs proteins (HSP90, HSP70, CRT and HMGB-1). C Immunofluorescence images of the above proteins (Scale bar, 50 μm). D Flow cytometry of CD11c + CD80 + DCs. E Near infrared thermal images of B16F10 tumor bearing mice. F Tumor pictures of mice after mild or strong PTT treatment. G Average relative tumor volume of mice. H Representative immunofluorescence images of T cell infiltration in tumor tissue. (Blue, nucleus; Green, CD3; Scale bar, 100 μm). *p < 0.05, **p < 0.01

