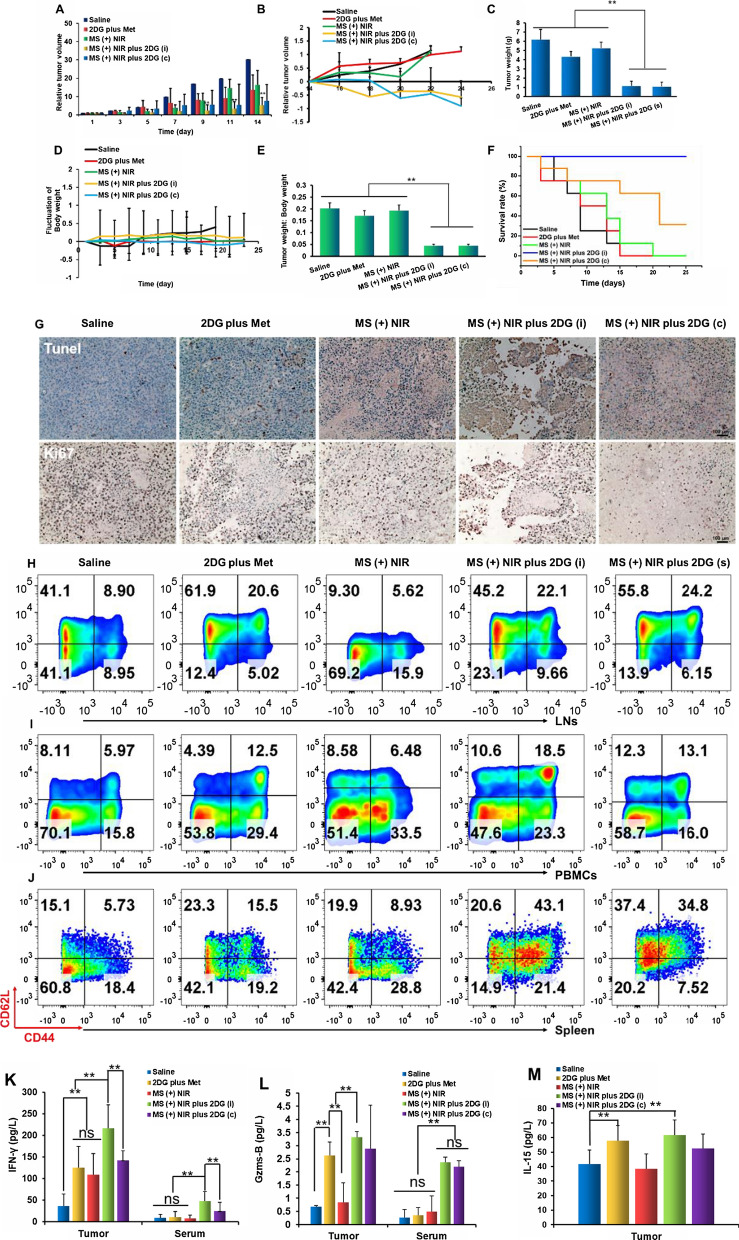
Fig. 6.
Antitumor efficacy and immune response in B16F10 tumor model. Relative tumor volumes of mice in each group within 14 days (A) and tumor volumes of the remaining mice (B). C Tumor weight of mice in different groups. D Body weight changes of mice. E The ratio of tumor weight to body weight after different treatments. F Survival curves of the tumor-bearing mice after 4 weeks treatments. G Ki67 and TUNEL of tumor tissues. Scale bars, 100 μm. (H–K) The proportion of central memory CD8+ T cells in LNs (H), PBMCs (I) and spleen (J). K–M The proportion of IFN-γ (L) and granzyme B (M) in tumor tissues and serum

