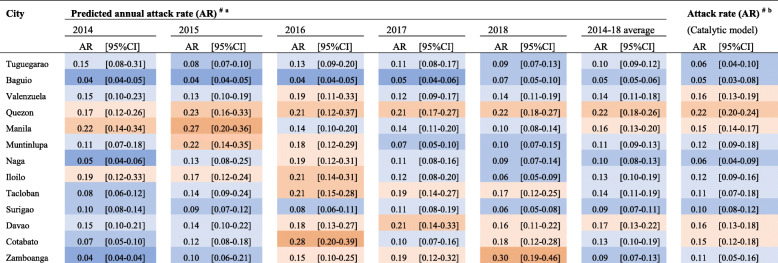
Table 2.
The annual predicted dengue attack rates among sampled cities between 2014 and 2018 according to the mean age of laboratory confirmed primary dengue infections. 95%CIs correspond to the upper and lower 95%CIs of the annual mean age of primary infections. Attack rates according to catalytic models were derived from FOI estimates from reversible catalytic models
#Attack rate (AR): 1-exp(-FOI)
aEstimated annual attack rate according to the FOI derived from the mean primary DENV age (FOI=0.041+1.329×0.797×), where x equals the annual mean primary dengue age
bEstimated annual attack rate according to the FOI derived from the reversible catalytic model, Eq. 2, where FOI equals λ
Attack rate
 0.25-0.30
  0.20-0.25
  0.15-0.20
  0.10-0.15
  0.05-0.10
  0.05-0.10

