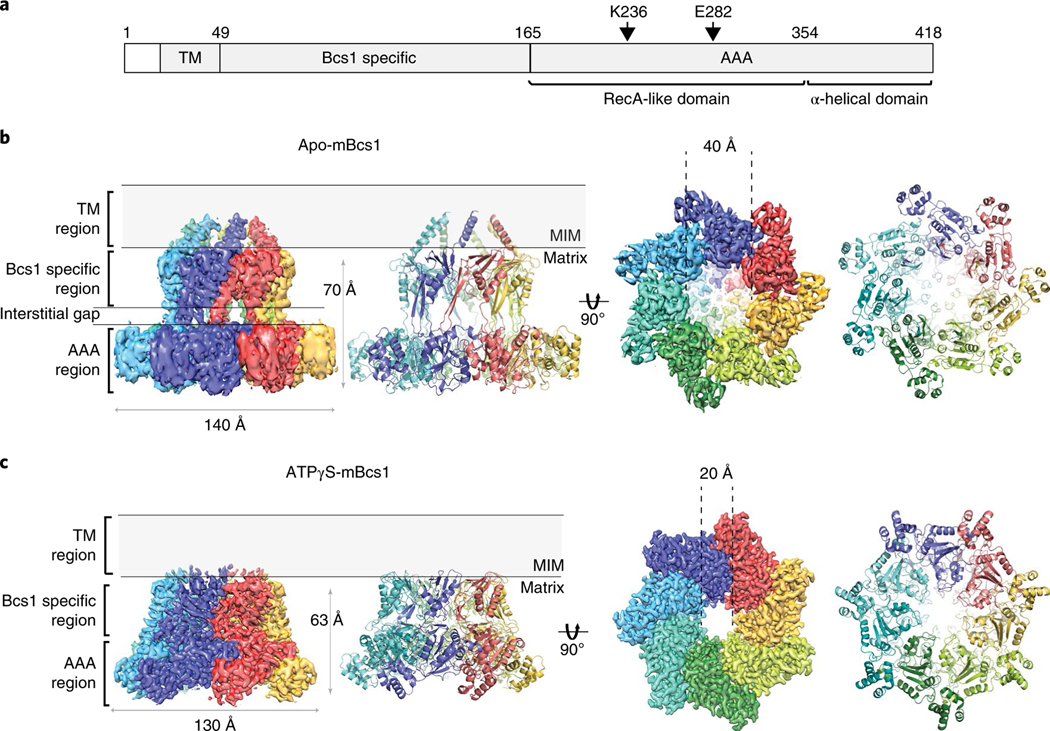
Fig. 1 |. EM density and heptameric organization of mBcs1.
a, Schematic diagram showing experimentally determined domain boundaries of mBcs1. In the apo structure, the model for the transmembrane (TM) domain begins at residue L29 and ends at I49. The Bcs1-specific domain spans the range of residues 49 to 165. The AAA domain is composed of the RecA-like (residues 165–354) and α-helical domains (residues 355–418). The Walker A residue K236 and Walker B residue E282 are indicated. b,c, EM density maps and atomic models for apo mBcs1 (b) and for the ATPγS-bound mBcs1 (c) in two orthogonal orientations: side view (left) and view from the matrix side (right). Each subunit is colored differently. The TM, Bcs1-specific and AAA regions of the protein are indicated. Most of the protein resides in the mitochondrial matrix. The ‘Interstitial gap’ is defined for the less-dense part of the Bcs1-specific region connecting to the AAA regions.

