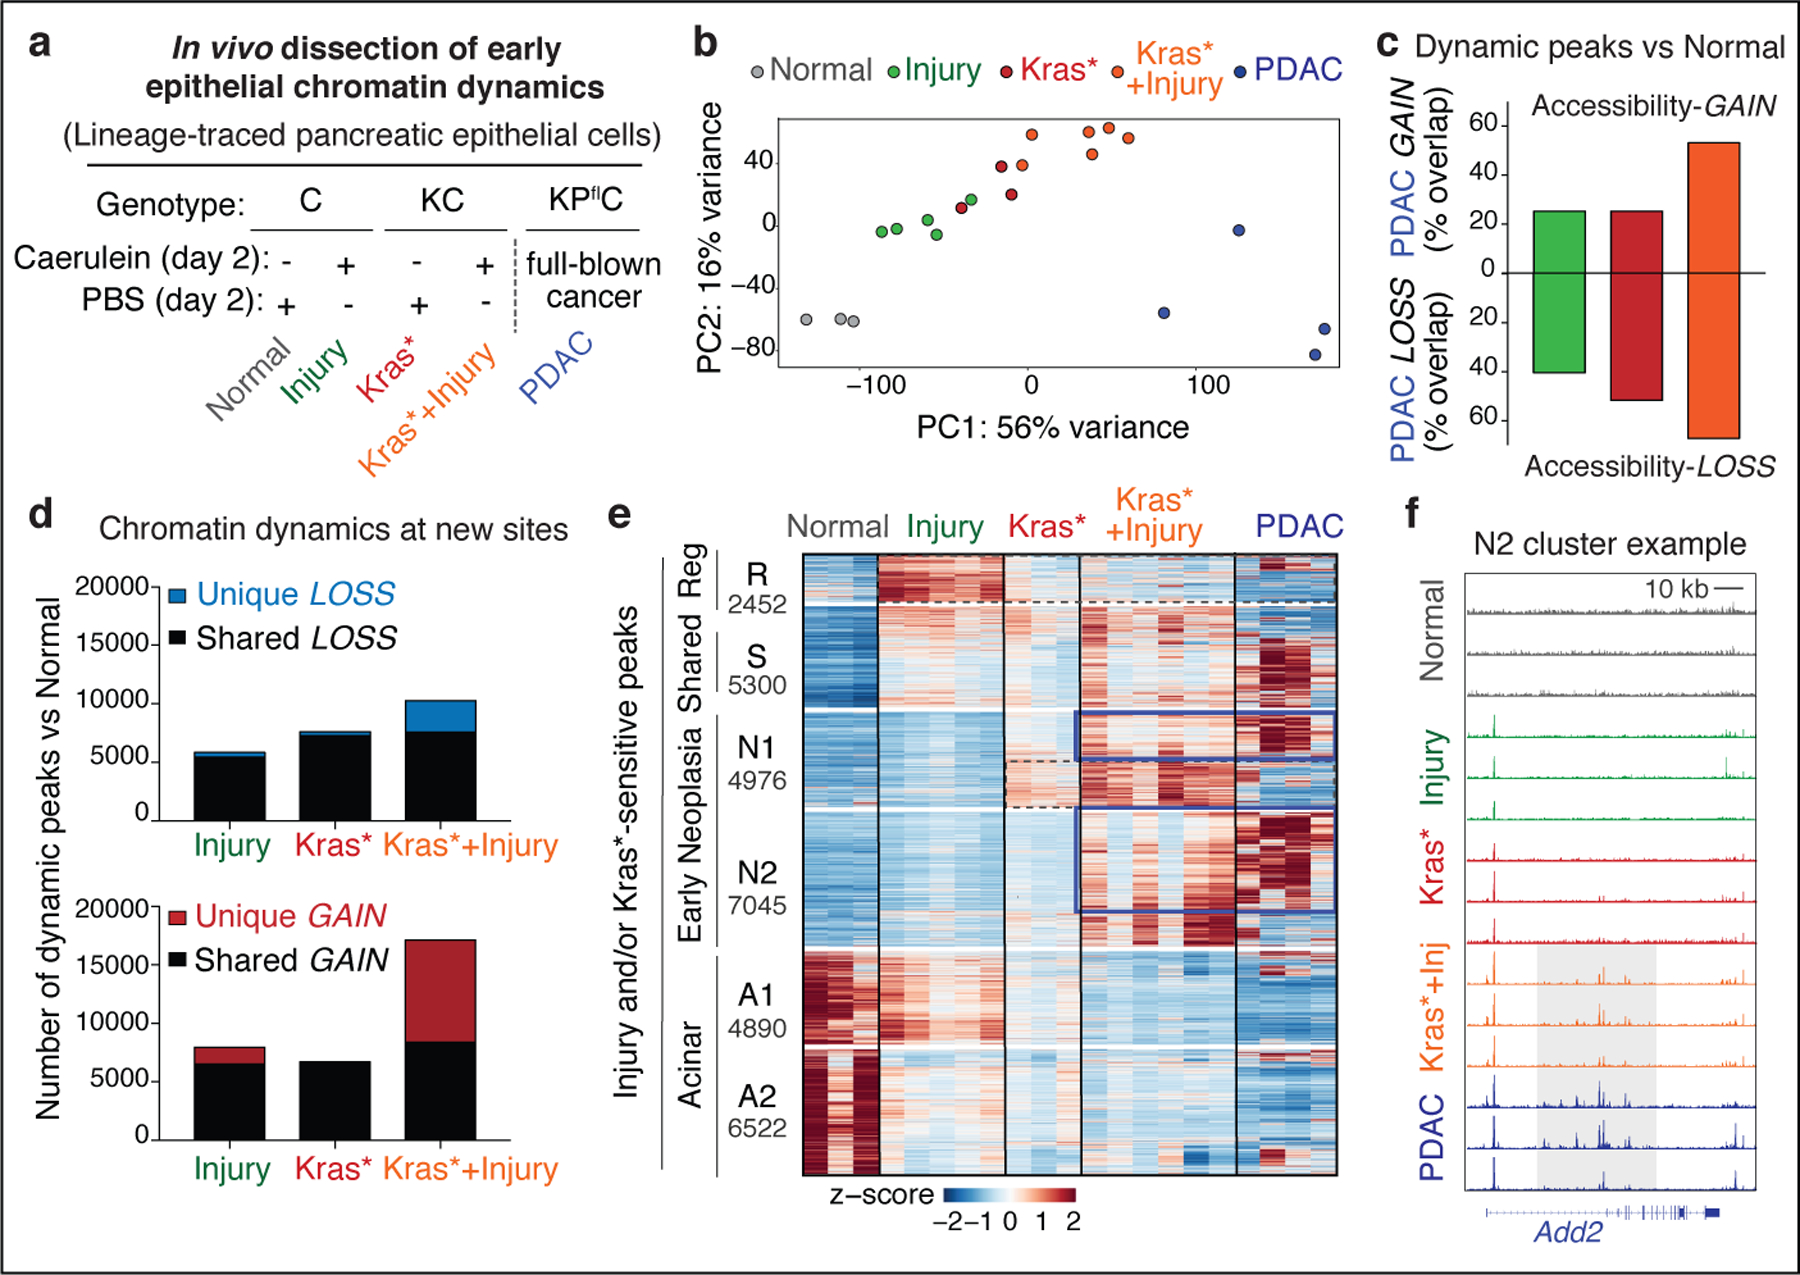
Fig 1. Tissue damage induces cancer-associated chromatin states in pre-malignancy.

a, Experimental settings to interrogate epithelial neoplastic reprogramming in vivo. Chromatin accessibility (and gene expression, below) analyses were performed on lineage-traced pancreatic epithelial cell populations FACS-isolated from well-defined tissue states (see main text). When applicable, tissue damage was induced by treatment with the synthetic cholecystokinin analogue caerulein6,8. b, Principal Component Analyses of ATAC-seq data from independent biological replicates of pancreatic epithelial cells isolated from tissue states described in (a). c, Proportion of ATAC-peaks significantly gained (top) or lost (bottom) in PDAC compared to Normal pancreas, and found similarly altered in pre-malignant tissues subjected to injury, expressing mutant Kras, or both. Bar color indicates experimental condition, as in (b). d, Number of ATAC-peaks that are significantly lost (top) or gained (bottom) in the indicated conditions vs Normal pancreas, shared or unique to each condition. e, Heatmap representation of peaks gained or lost between Normal, Injury, Kras* and Kras*+Injury conditions. Each column represents an independent mouse. Numbers indicate the number of peaks per cluster. f, ATAC-seq tracks at a N2-cluster locus exhibiting synergistic accessibility-GAINS by combination of injury and mutant Kras (one independent mouse per lane). y-axis scale range per lane [0–60]. In c, d, bar charts summarize the degree of overlap between dynamic ATAC-peaks identified by DESeq2 analyses (log2FC >= 0.58; FDR <=0.1) comparing Injury (n=5 mice), Kras* (n=3 mice), Kras*+Injury (n=6 mice), or PDAC (n=4 mice) conditions versus Normal (n=3 mice).
