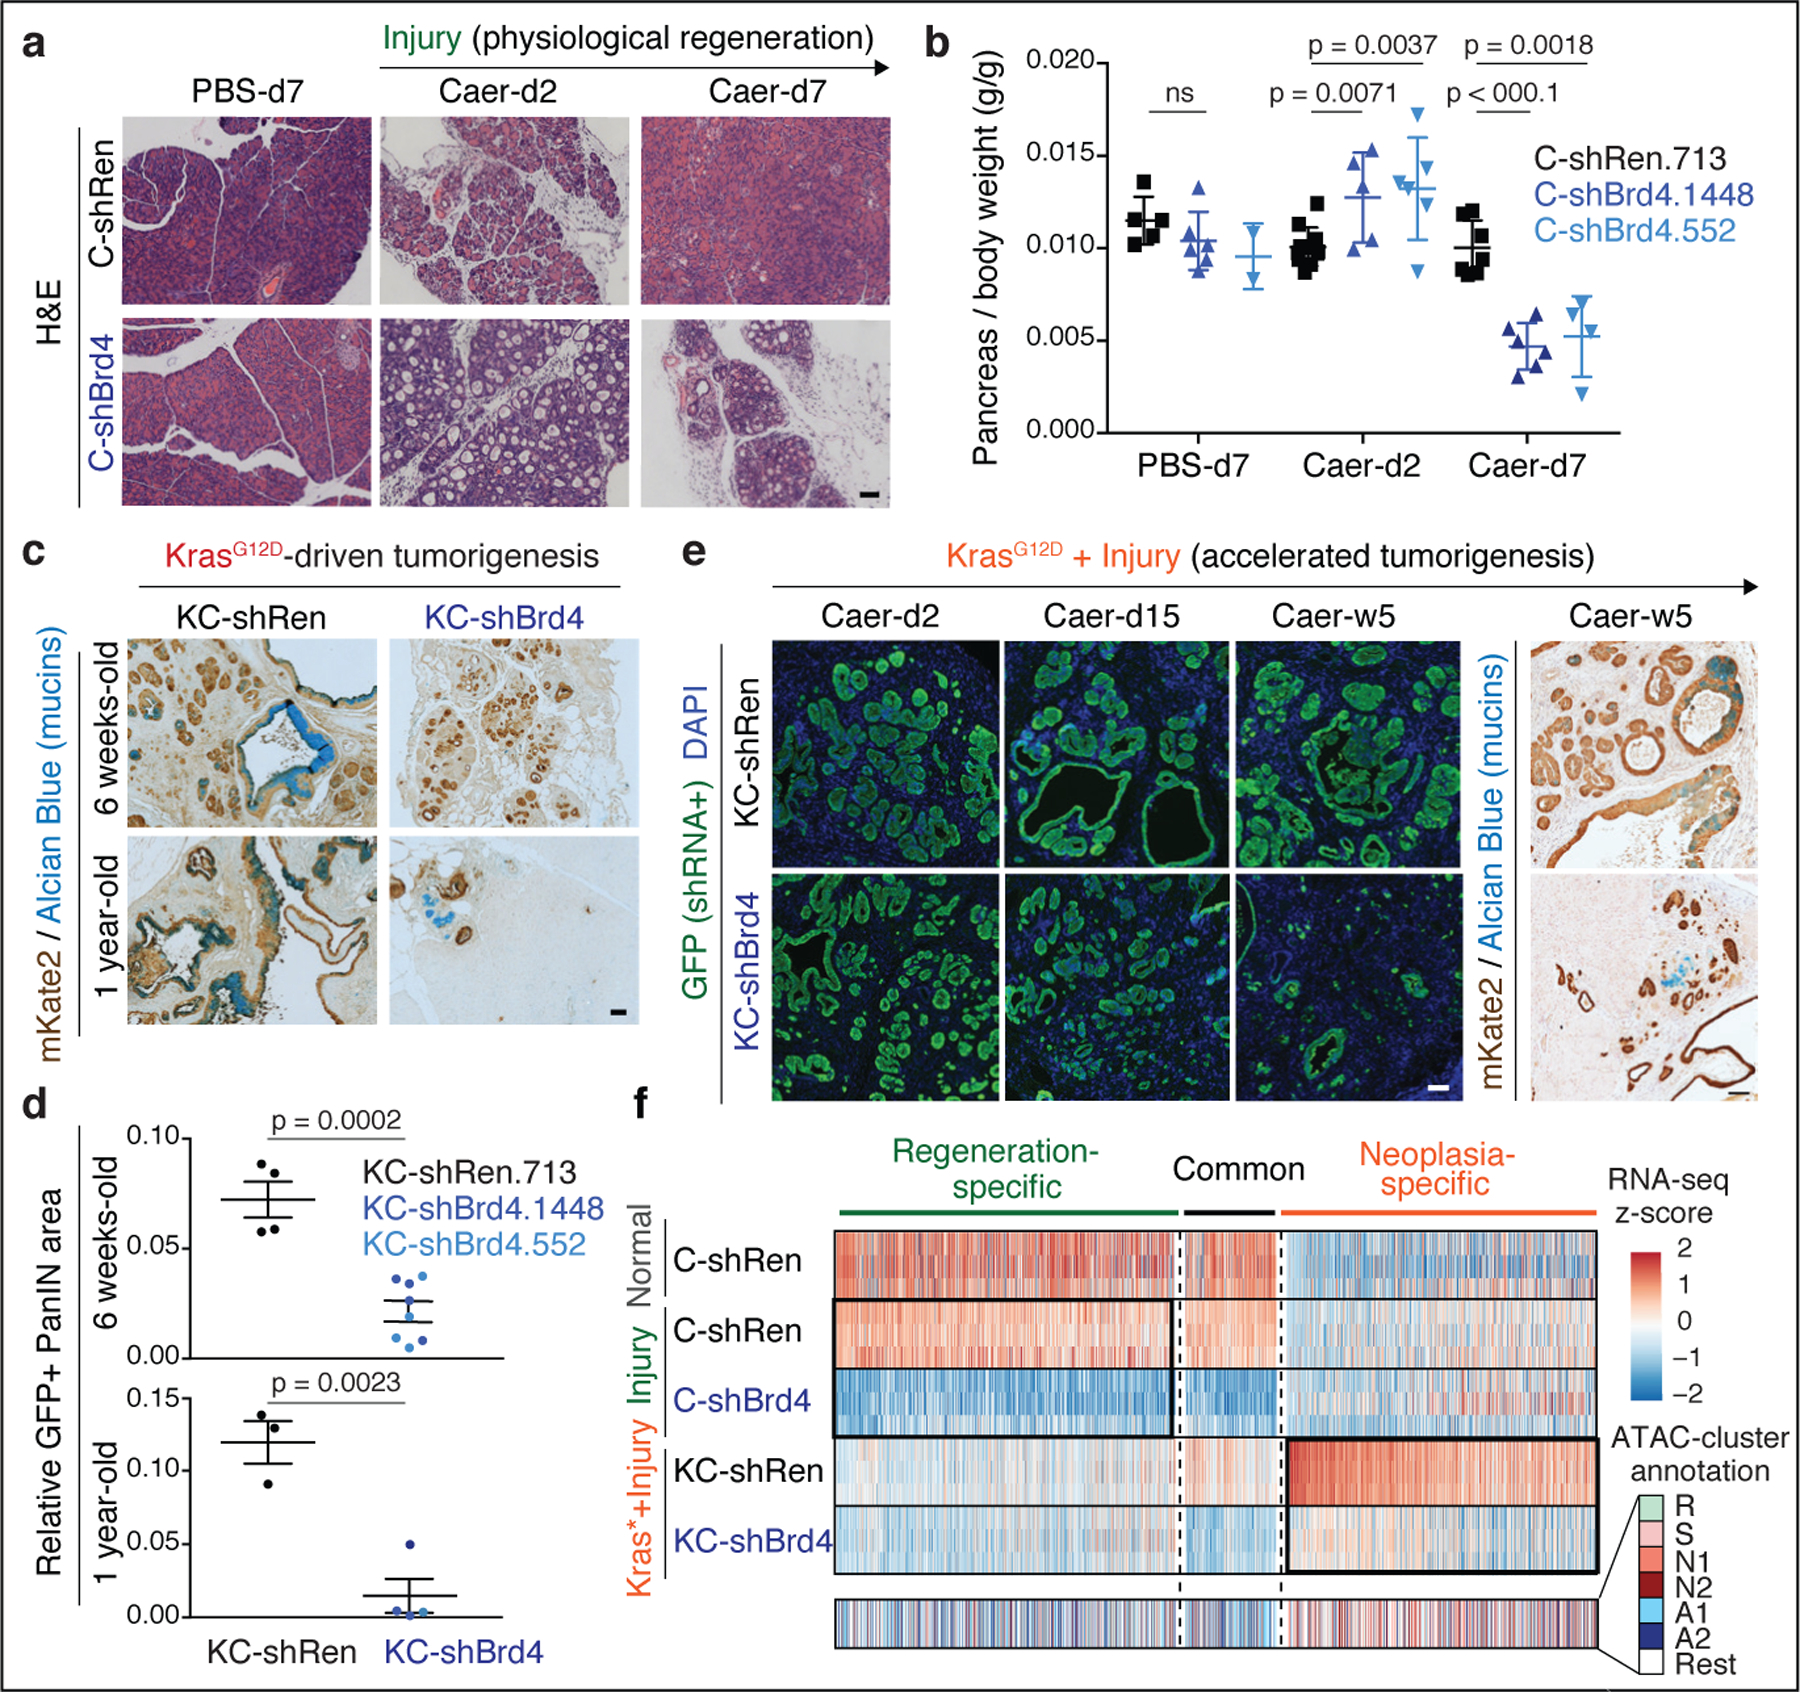
Fig. 3. Neoplastic and regenerative outcomes of injury rely on distinct Brd4-dependent programs.

a, Representative H&E of pancreata from Kras wild-type C-shRen (control) or C-shBrd4 (sh552) mice treated with Caerulein (Caer) or PBS harvested at indicated days (d) post-treatment (number of mice/group, as in b). b, Quantification of pancreas-to-body weight ratio of C-shRen or -shBrd4 mice at indicated time-points after caerulein treatment, denoting rapid loss of pancreatic tissue in shBrd4 mice between day-2 and day-7 post-injury. n = 5, 6, 2, 11, 5, 6, 7, 6 or 4 (from left to right) mice/group. c, Representative IHC of mKate2 and Alcian blue in pancreata from KC-GEMM-shRen.713 or -shBrd4.552 mice placed on dox diet since postnatal day 10, analyzed at indicated time points. d, Quantification of PanIN lesion area in pancreata from 6 week-old KC-shRen (n=4) or -shBrd4 (n=8) mice, or 1-year-old KC-shRen (n=3) or KC-shBrd4 (n=4) mice. e, Representative immunofluorescence (GFP) and IHC (mKate2, Alcian blue) to visualize the progression of Kras-mutant cells expressing Ren or Brd4 shRNAs (mKate2+;GFP+) upon injury-accelerated pancreatic neoplasia, analyzed at indicated days (d) or weeks (w) post-Caer (n=3 mice/group). f, (Top) Heatmap of downregulated DEGs upon Brd4 suppression in regenerative metaplasia (Csh:Injury) or neoplastic transformation (KCsh:Kras*+Injury) settings across indicated conditions (as in Extended Data Fig. 4a). n=3 shRen.713 or shBrd4.1448 mice (rows) per condition. Normal C-shRen samples show expression levels of DEGs in healthy pancreas. Black squares delineate genes uniquely sensitive to Brd4 suppression in cells undergoing injury-driven regenerative (left) vs neoplastic (right) transitions. See Supplementary Table 4 for list of shBrd4-sensitive genes in each context. (Bottom) Chromatin accessibility dynamics at regulatory loci of shBrd4-sensitive genes, indicated by ATAC-cluster annotation. In b, d, data presented as means±s.e.m and significance assessed by unpaired two-tailed Student’s t-test (ns, non-significant). Scale bar, 100 μm.
