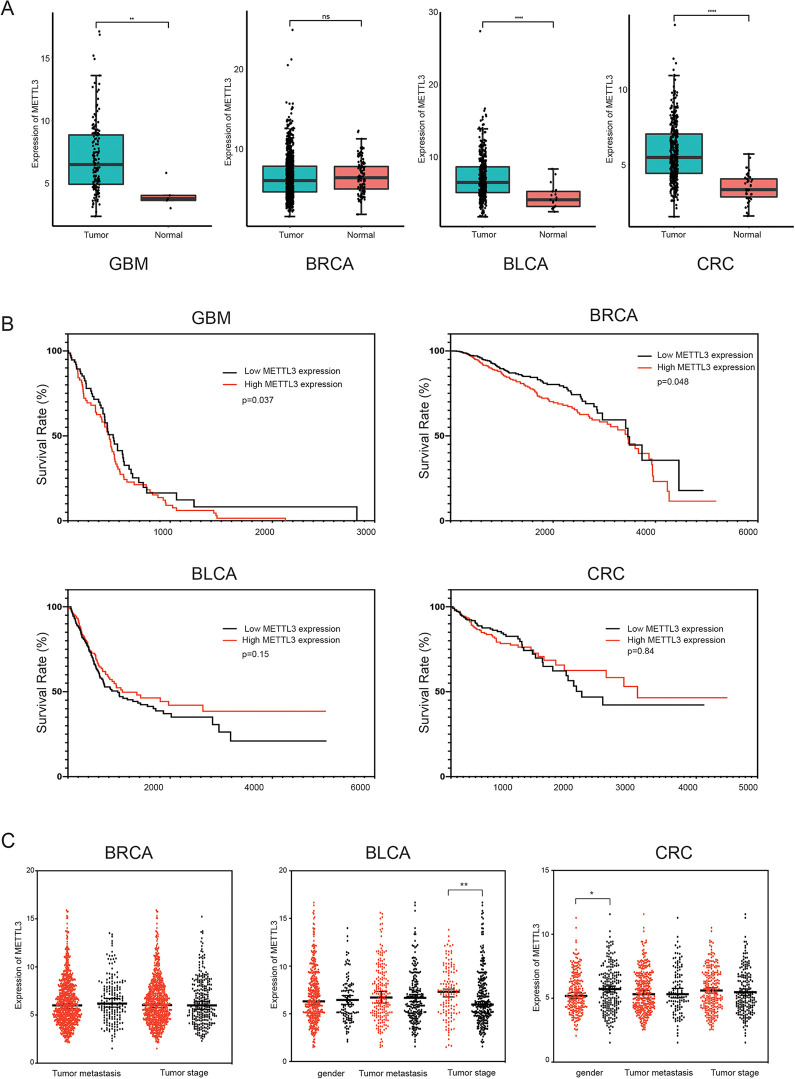
Figure 4.
Bioinformatics analysis using data from TCGA. (A)The expression levels of METTL3 in 4 kinds of cancer tissues and normal tissues in GBM, BRCA, BLCA and CRC. (B)Survival curves of METTL3 are plotted for 4 cancer types from TCGA dataset. The survival curve of patients with GBM, BRCA, BLCA and CRC. (C)The expression of METTL3 in different gender, tumor metastasis, tumor stage in BRCA, BLCA and CRC, respectively.

