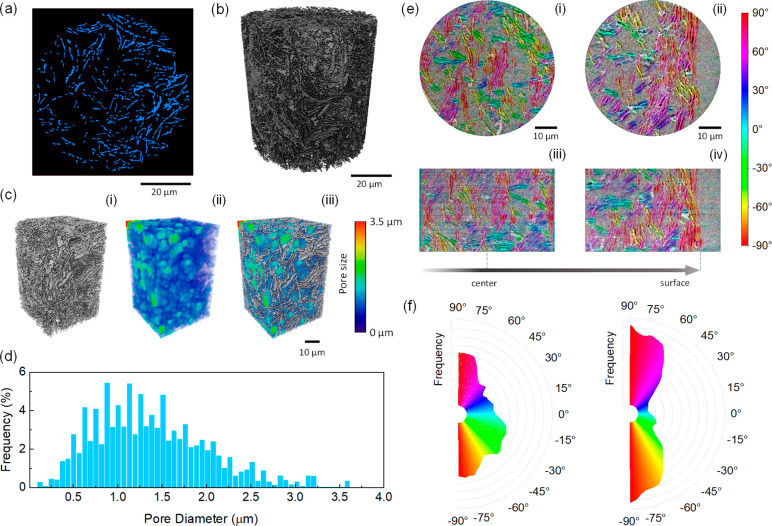
Figure 3.
a,b) Reconstruction of a printed filament obtained from X-ray Nano-Computed Tomography: (a) slice perpendicular to the filament axis and (b) 3D rendering of the central region of the filament. c) 3D visualization of the region considered to calculate porosity: (i) PG platelets, (ii) pores, and (iii) simultaneous visualization of PG platelets and pores. d) Pore size distribution in the printed filament. e) Orientation of the platelets in the central (i), (iii) and outer (ii), (iv) regions of the filament: (i) and (ii) represent slices perpendicular to the filament axis, while (iii) and (iv) represent slices along the filament axis. f) Radial histograms presenting the orientation of platelets in the central (left) and outer (right) regions of the printed filament, respectively.

