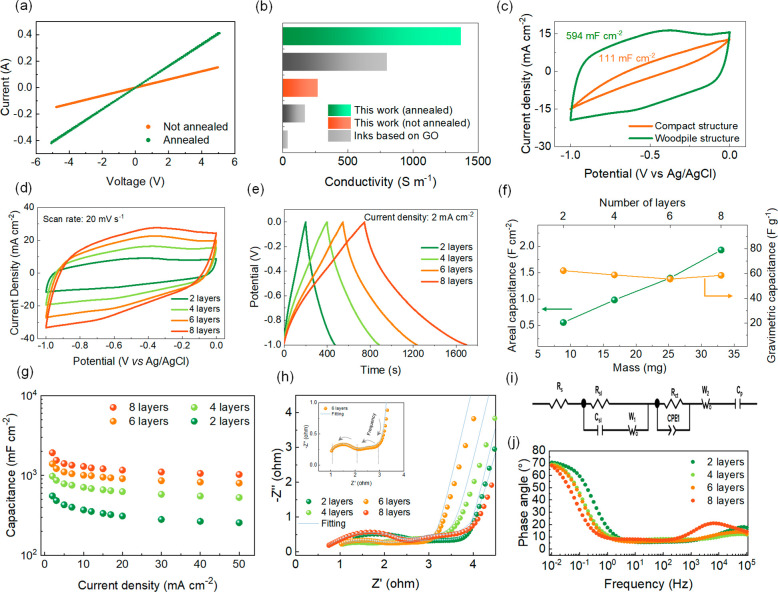
Figure 4.
a) I–V curve for the PG ink before and after the annealing process. b) Electrical conductivity of the PG ink before and after the annealing process compared with three different DIW inks based on GO (references were included in Table S3). c–i) Electrochemical performance of printed electrodes in a three-electrode system. c) CV curves for a 4-layer woodpile (green) and compact (orange) PG structures, d,e) CV and GCD curves for woodpile electrodes at an increasing number of layers, and f) comparison of the areal and gravimetric capacitance of the woodpile electrodes with a different number of layers. g) Areal capacitance of PG electrodes (2 to 8 layers) at different current densities, h) EIS curves on 2- to 8-layer electrodes between 0.01 Hz and 100 kHz, (i) EIS fitting circuit, and j) Bode plots for the woodpile electrodes with different numbers of layers.

