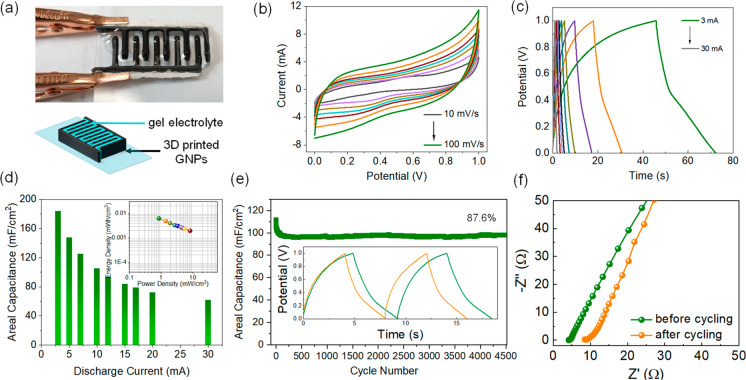
Figure 6.
a) Picture and schematic of a quasi-solid-state interdigitated device printed on a glass substrate and filled with the gel electrolyte (footprint area ∼1.7 cm2). b) CV curves of the interdigitated PG device at different scan rates (10 to 100 mV s–1). c) GCD on the interdigitated PG at different currents (3 to 30 mA) and d) capacitance retention of the interdigitated device at an increasing discharge current. The inset in d) shows a Ragone plot for the interdigitated device. e) Cycling test on the interdigitated device at a current of 10 mA (inset shows the first two and last two charge–discharge curves, in green and orange, respectively). f) EIS on the interdigitated device before and after cycling.

