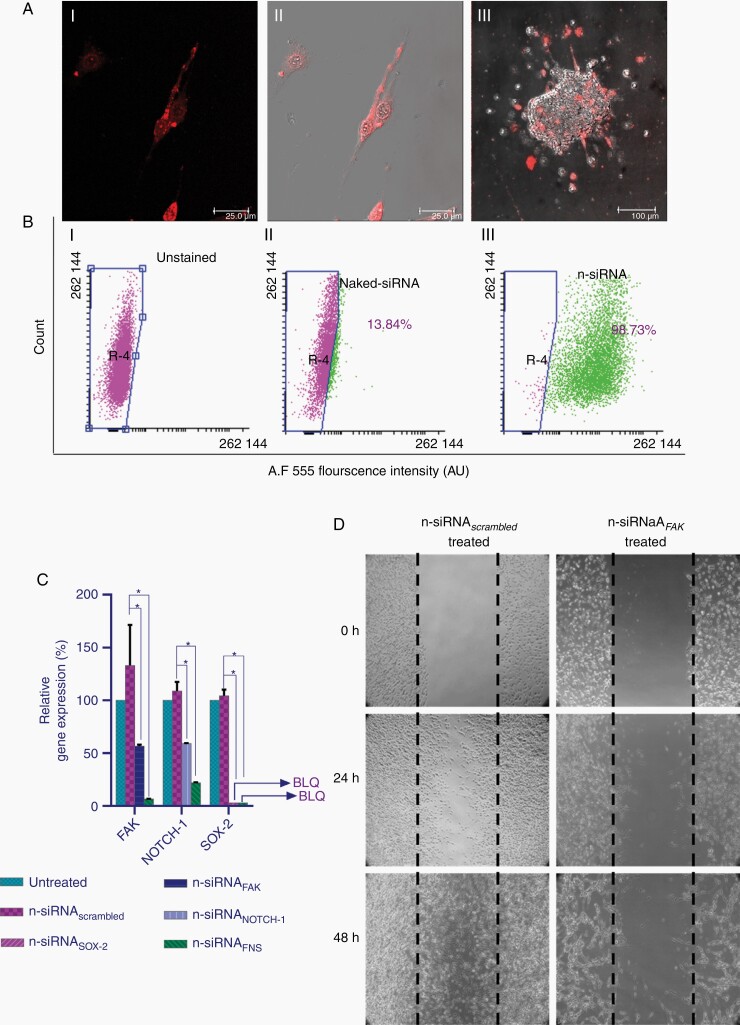
Figure 2.
n-siRNA uptake and functional activity in rat C6 glioma cells. (A) Representative confocal images showing n-Cy5-siRNA uptake in (i) C6 cells (red) (ii) corresponding merged image (iii) merged confocal image in C6 neurospheres. (B) Flow analysis of n-siRNA uptake showing (i) unstained, (ii) naked-siRNA, and (iii) n-siRNA (Alexaflour 555) in C6 neurospheres, indicating uptake in 98.7% cells. (C) Relative gene expression levels of FAK, NOTCH-1, and SOX-2 gene analyzed by quantitative real-time PCR after treatment with n-siRNAFAK, n-siRNANOTCH-1 or siRNASOX-2 (100 nM each), *P < .05 compared to corresponding untreated. (D) Wound healing assay showing inhibition of cell migration in n-siRNAFAK treated C6 glioma cells. Data are mean ± standard deviation.

