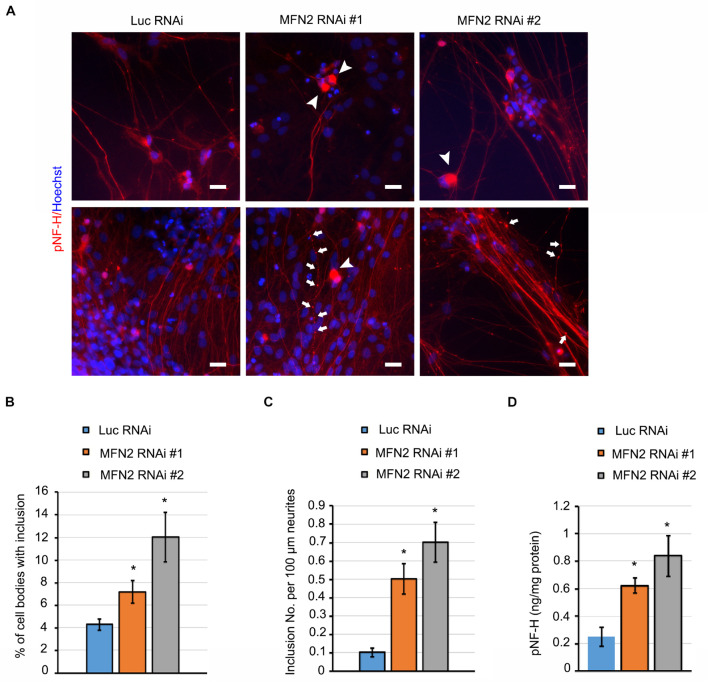
FIGURE 4.
MFN2 deficit induced pNfH inclusion in cell bodies and neurites of spinal motor neurons. (A) Immunofluorescent images of pNfH (Red) in spinal motor neurons. Arrowheads indicate pNfH inclusions in the cell bodies; arrow indicates pNF-H inclusions in neurites. Scale bar: 20 μm. (B) Quantification of cell bodies with inclusion in MFN2 RNAi #1, MFN2 RNAi #2, and Luc RNAi spinal motor neurons. (C) Quantification of inclusion numbers per 100 μm neurites in MFN2 RNAi #1, MFN2 RNAi #2, and Luc RNAi spinal motor neurons. (D) ELISA quantification of pNfH level in conditioned cell culture media (normalized to protein). Data are represented as mean ± SEM, n = 3 independent experiments. *p < 0.05 compared with Luc RNAi spinal motor neurons.

