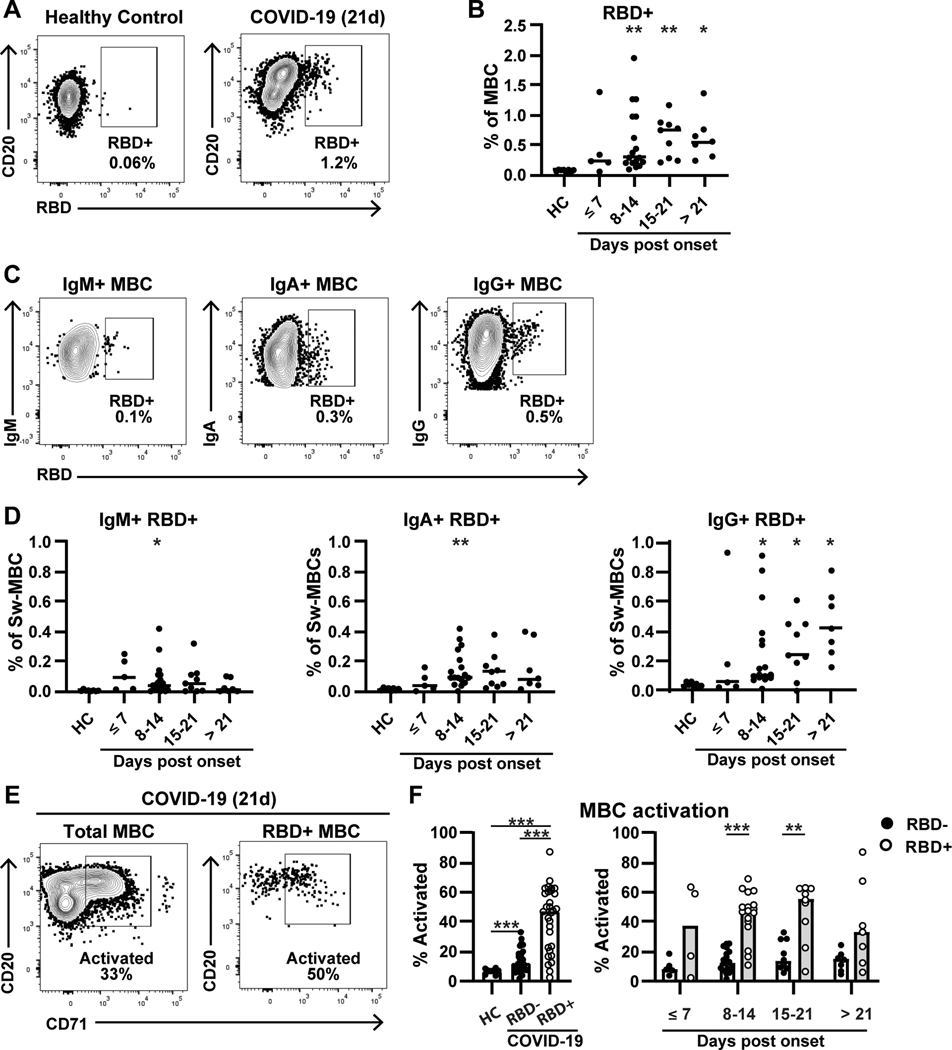
Figure 2: RBD-specific memory B cells expand rapidly and exhibit high levels of activation in COVID-19 patients.
A) RBD-specific memory B cells (CD19+CD20+IgD-CD38-) are shown for a healthy control (left) or COVID-19 patient (right). B) RBD+ MBCs are shown as a percentage of total MBCs for healthy controls (n=8) and COVID-19 patients (n=34) over time. Four COVID-19 patients contribute repeat timepoints. C) Gating is shown for IgM+ (left), IgA+ (middle), and IgG+ (right) RBD+ MBCs in the COVID-19 patient shown in (A). Percentages shown are % of total MBC. D) RBD+ MBCs are shown as in (B), split into IgM+ (left), IgA+ (middle) and IgG+ (right). E) Activated B cells, gated by CD71 expression, for both total (left) and RBD+ (right) MBC. F, left) Total activation in healthy controls (n=8) and COVID-19 patients RBD- MBC (n=33) or RBD+ MBC (n=30). F, right) A comparison of activation over time between RBD- and RBD+ MBC. Significance is calculated by Brown-Forsythe ANOVA test (B, D, F left) or Holm-Sidak multiple T test (F right). *p≤0.05, **p≤0.01, ***p≤0.001

