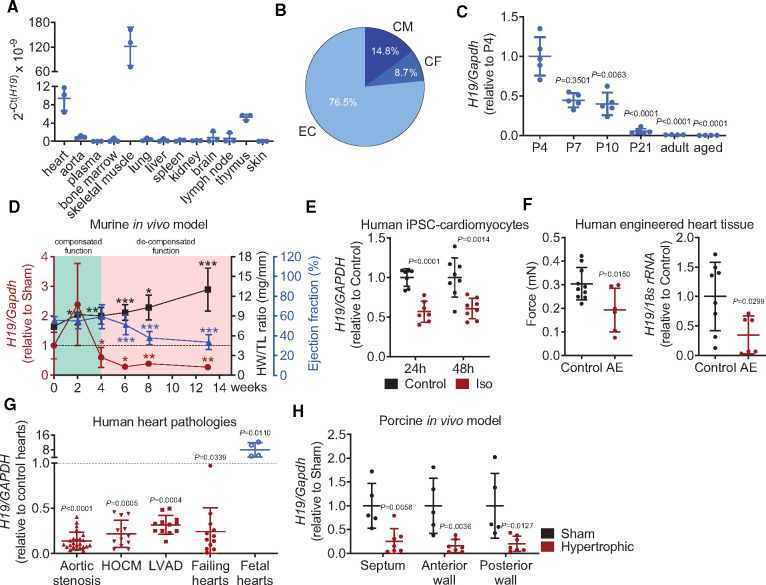
Figure 1.
Cardiac hypertrophy-associated repression of H19 is conserved among mice, humans, and pigs. (A) Abundance of H19 in various mouse organs (n = 3). (B) Distribution of H19 in a cardiac fraction of murine hearts (CM, cardiomyocytes; CF, cardiac fibroblasts; EC, endothelial cells; n = 8). (C) H19 in stages of murine heart development (n = 4–5). (D) H19 expression levels, heart weight-to-tibia-length ratio (HW/TL), and ejection fraction (EF) over the time course of heart failure progression (TAC, transverse aortic constriction; n = 5–8). (E) H19 gene expression in human induced pluripotent stem cell (iPSC)-derived cardiomyocytes after pro-hypertrophic stimulation (Iso, isoproterenol; n = 3). (F) Contractile force measurements and human H19 levels in human engineered heart tissue with and without afterload enhancement (AE; n = 6–8). (G) Expression of human H19 in patient-derived cardiac material compared to corresponding control tissues (indicated as dashed line) (HOCM, hypertrophic obstructive cardiomyopathy; LVAD, left ventricular assist device). (H) H19 Expression in different heart segments of hypertrophic pigs and Sham animals. Data are means ± SD. P-values were determined by two-tailed unpaired Student’s t-test. *P < 0.05; **P < 0.01; ***P < 0.001.

